The cryptocurrency market is witnessing a surge in the prices of two prominent digital assets: Jupiter (JUP) and Bitcoin Cash (BCH). These tokens have exhibited bullish technical indicators and breakouts from significant chart patterns.
What you'll learn 👉
Jupiter (JUP): Breaking Out of an Ascending Channel
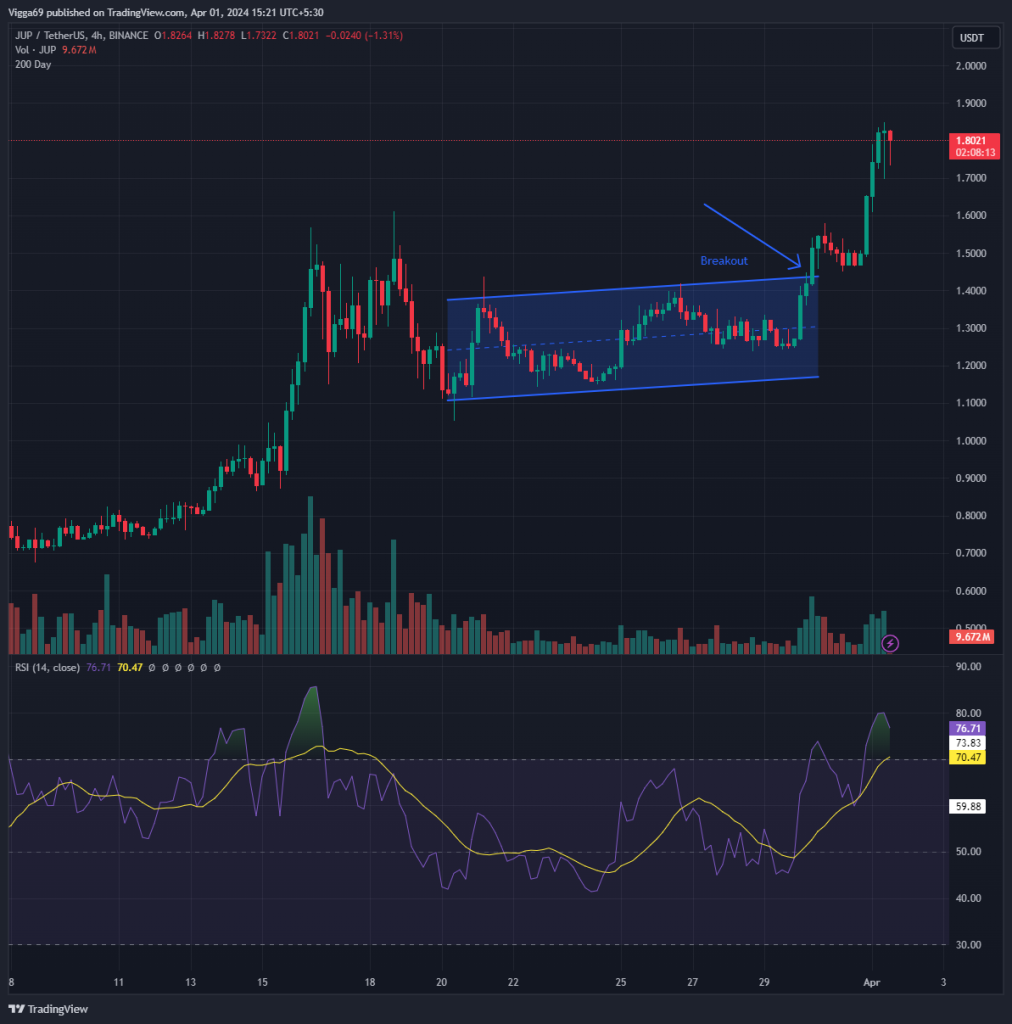
Jupiter (JUP) has experienced a remarkable 22.42% price increase over the past 24 hours, propelling its market capitalization to $2,438,585,441 and securing the #54 spot in the cryptocurrency rankings. The trading volume for JUP has also skyrocketed by 56.17%, reaching $657,852,595.

According to our technical analysis, JUP has broken out of an ascending channel pattern, which is typically considered a bullish signal. The Relative Strength Index (RSI) on the daily chart currently stands at 78, indicating that JUP is in an overbought condition. An RSI above 70 suggests that the asset is potentially overvalued and may be due for a correction or consolidation in the short term.
Doge2014 raises 500K in days celebrating Dogecoin. Make potentially big profits and get in on exclusive airdrop!
Show more +Bitcoin Cash (BCH): Escaping a Descending Channel
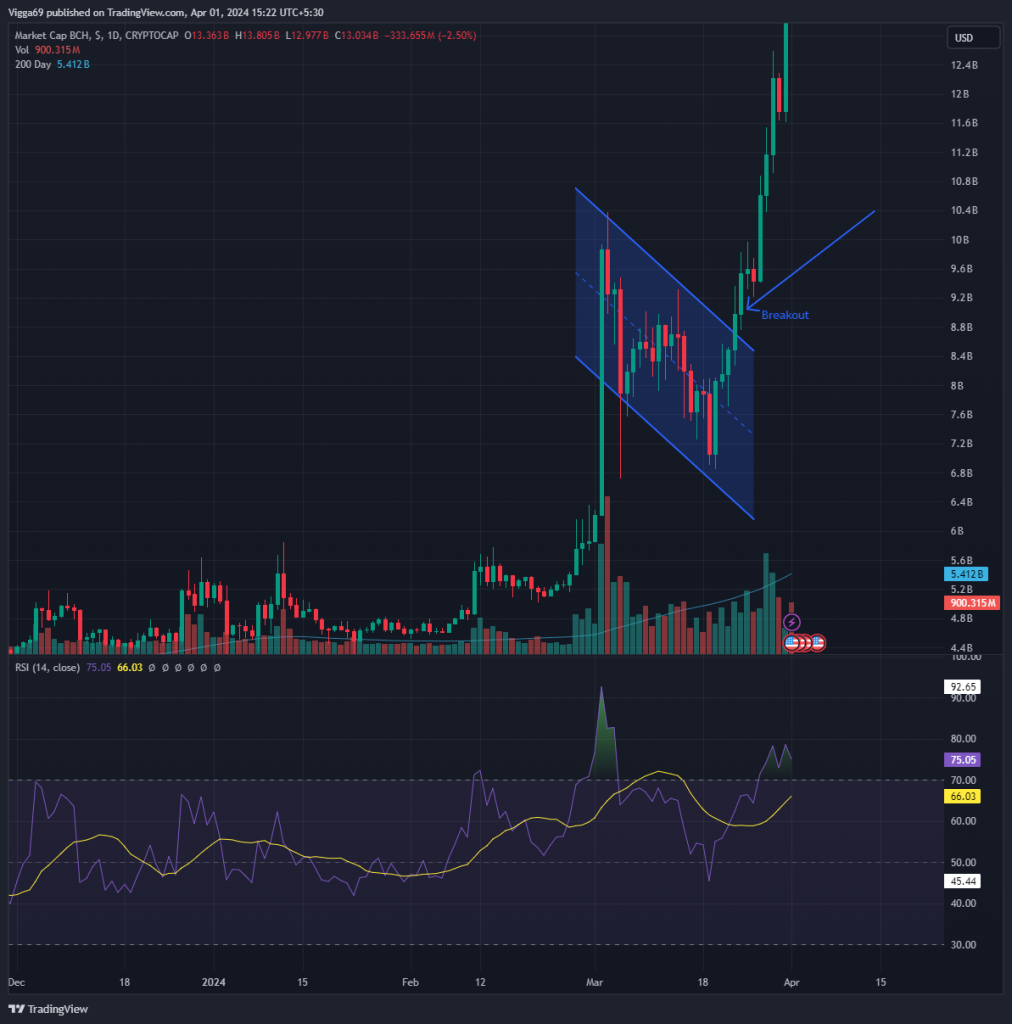
Bitcoin Cash (BCH), the popular fork of Bitcoin, has also experienced a significant price pump, surging 12.22% over the past 24 hours. This rally has propelled BCH’s market capitalization to $13,064,389,616, securing the 14 spot among cryptocurrencies. Moreover, the trading volume for BCH has skyrocketed by an astonishing 271.98%, reaching $1,649,374,088.
Technical analysis shows that BCH has broken out of a descending channel pattern, typically interpreted as a bullish signal. Similar to JUP, the daily chart RSI for BCH currently stands at 75, suggesting that the asset is in an overbought condition and may be due for a correction or consolidation in the near future.

BCH’s Bullish Indicators and Potential Catalysts
Despite Bitcoin’s bearish start, BCH showcases a strong bullish trend, potentially driven by anticipation surrounding the upcoming Bitcoin halving event. As a cheaper alternative to Bitcoin, BCH is expected to benefit from the increased interest and investment during this period.
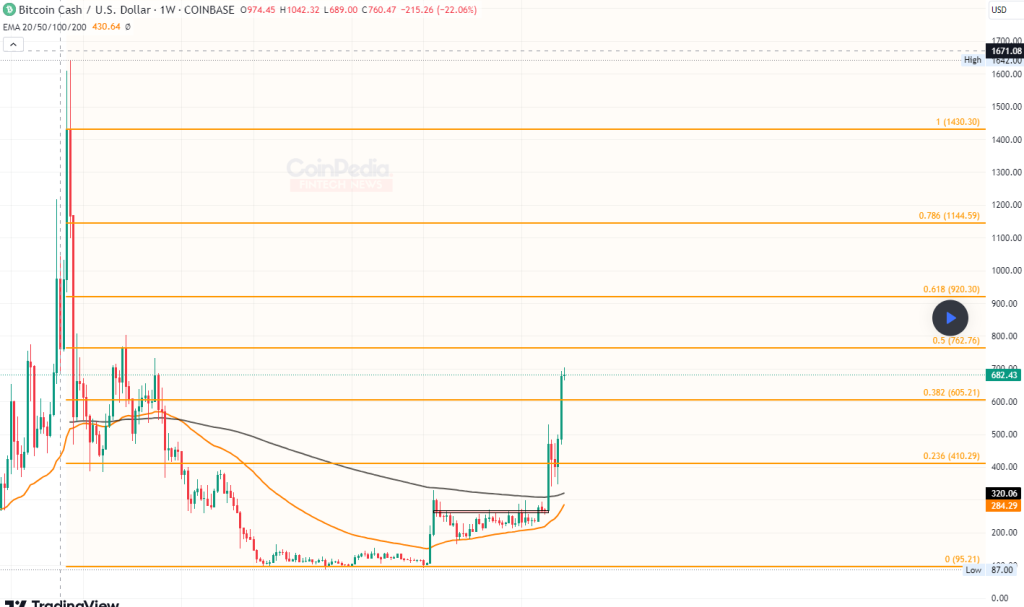
Coinpedia’s analysis highlights several bullish indicators for BCH, including:
- A bullish flag pattern, indicated by a range breakout and massive engulfing candles.
- Surpassing the 23.60% and 38.20% Fibonacci levels, with the next target being the 50% level at $762.
- Expansion of the upper Bollinger Band, showing buyer dominance.
- Notable resistance levels at $762 and $920, with potential sights set on $1,000.

Currently trading at $678, BCH exhibits an indecisive pattern with a Doji candle formation, but the overall bullish sentiment surrounding the crypto market could potentially push BCH towards the $1,000 mark.
The breakouts observed in both JUP and BCH have sparked excitement among traders and investors, as these technical signals often precede sustained rallies. However, it is crucial to exercise caution, as overbought conditions can lead to temporary corrections or consolidation phases before the uptrend resumes.
Market participants will closely monitor the price action of JUP and BCH, seeking to capitalize on potential upside or mitigate risks through effective risk management strategies. The confluence of bullish technical indicators and the overall market sentiment surrounding these digital assets suggests that further price appreciation could be on the horizon, albeit with potential volatility along the way.
You may also be interested in:


