
The price of JasmyCoin (JASMY) rallied from deep support levels and has already climbed around 130% from its lowest point. Now trading near $0.0154, it seems to be holding just above a key support area that has played a big role in its previous cycles.
The chart shared in a tweet by Solberg Invest shows a long-term weekly view of JASMY/USDT. It highlights how important the zone between $0.0085 and $0.012 has been historically. This range has acted as a solid foundation where buyers have repeatedly stepped in.
The price bounced off this green support box again in recent weeks, suggesting that confidence is returning and that this area could be the launching pad for a broader rally.
What you'll learn 👉
Pattern Hints at a Long-Term Breakout for JASMY Price
Looking at the structure on the chart, a potential double bottom formation seems to be taking shape. This kind of pattern is often seen as a bullish reversal signal, especially when it forms near long-term support.
The chart includes a bold orange line projecting a steep upward path that could take the JasmyCoin price to around $0.05984. That’s not just a random number, it matches one of the previous major highs from early 2022.
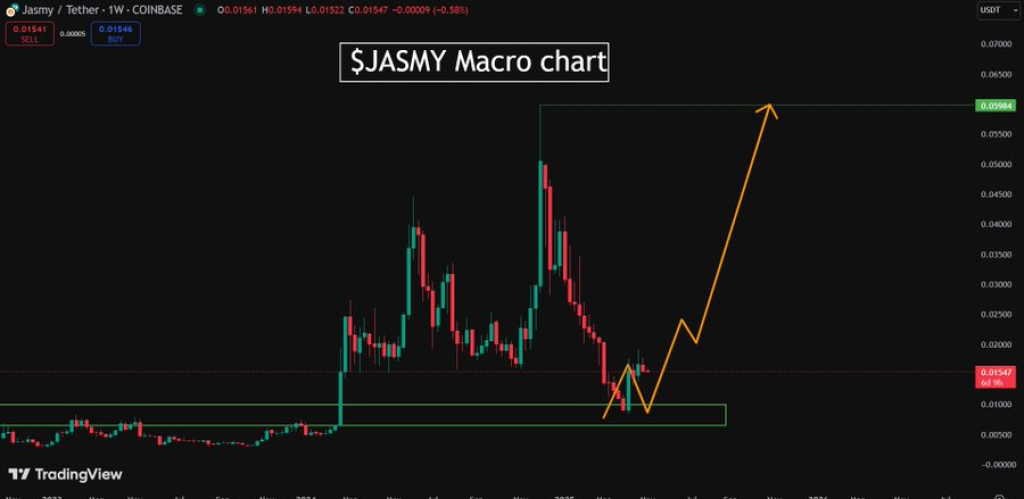
Source: Solberg Invest / X
Solberg Invest pointed out that this zone is his main target for JASMY. He noted that JASMY is already up a lot since he first encouraged followers to buy. That early call likely came when the token was in the green accumulation zone. With the 130% rise already in the books, he still sees room for another strong leg upward, targeting nearly 287% more growth from current prices.
Holding the Line is Key for JASMY Price
For this scenario to play out, though, JasmyCoin needs to continue holding above the green support area. If that floor breaks, the bullish setup could fail, and price momentum may fade. But if this level holds, and the current bounce is anything to go by, JASMY might just be in the early stages of a longer-term recovery.
Read Also: JasmyCoin Looks Ready to Explode: Price Structure and 2025 Roadmap Fuel Bullish Outlook
The chart shared by Solberg Invest captures that big-picture view well. It shows a classic pattern of market bottoming, followed by early signs of accumulation and now a developing trend reversal.
If broader market conditions stay favorable and JASMY keeps trading above its key support zone, the path toward $0.059 might not just be possible, it could be the start of something much bigger.
Subscribe to our YouTube channel for daily crypto updates, market insights, and expert analysis.

We recommend eToro
Wide range of assets: cryptocurrencies alongside other investment products such as stocks and ETFs.
Copy trading: allows users to copy the trades of leading traders, for free.
User-friendly: eToro’s web-based platform and mobile app are user-friendly and easy to navigate.