
XDC price is showing a pattern that has led to big rallies in the past. A crypto analyst named Tokenicer pointed out that XDC is now forming a familiar shape on the chart called a falling wedge. This same pattern happened before two major XDC breakouts. If it happens again, the XDC token might be getting ready to move up.
The falling wedge is a chart pattern that shows price slowly dropping inside a tight range. But once it breaks out, it often leads to a strong rally. Tokenicer said this happened with XDC two times already.
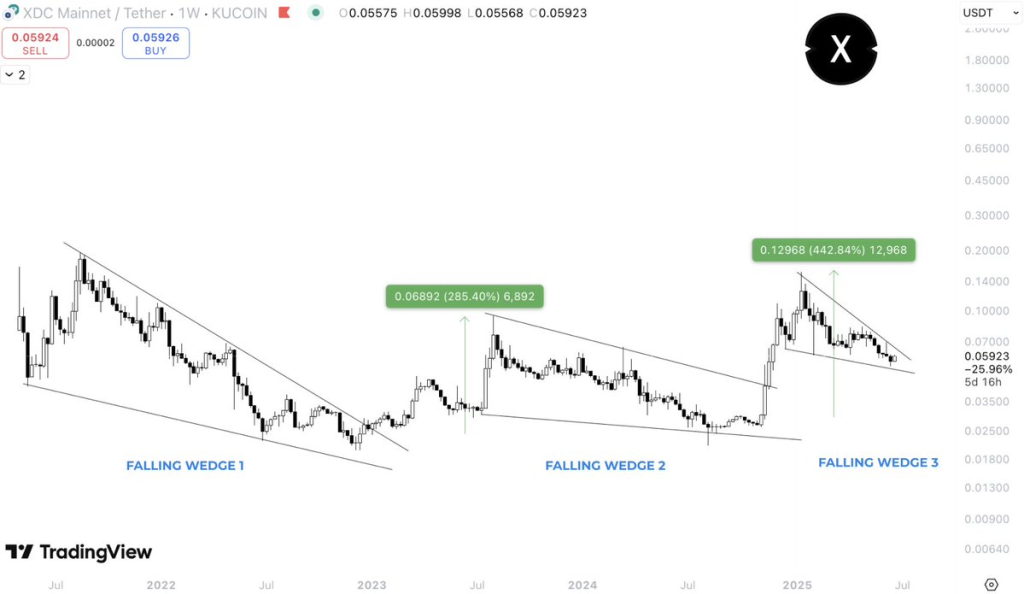
- In December 2022, XDC broke out of a falling wedge and jumped 285%.
- In November 2024, it broke out again and surged 440%.
Now, the same kind of wedge is forming again. Tokenicer posted a chart showing the current setup. It looks very similar to the last two. If XDC breaks out the same way again, the price could go much higher.
This third wedge is forming at a time when tokenization and crypto regulations are growing. These trends could help the XDC Network because it focuses on using blockchain for things like trade finance and real-world asset tokenization.
Tokenicer believes that all of this could give XDC more support. If the market conditions stay strong and the pattern completes, there’s a chance for another rally.
Read Also: Massive JasmyCoin Rally Incoming? Familiar 6x Bullish Pattern Is Back
What to Watch Next for XDC Token
Right now, XDC is moving inside the wedge. Traders are watching to see if it breaks out like it did before. If the XDC price moves above the wedge with strong momentum, it could signal the start of another rally.
Tokenicer thinks this setup is bullish and if XDC follows the same path again, it could lead to another big price move. Nothing is guaranteed, but this pattern has worked before, and many are watching to see if it happens a third time.
Subscribe to our YouTube channel for daily crypto updates, market insights, and expert analysis.


