Is the Arbitrum (ARB) Price Set to Explode? This Chart Reveals the Comeback No One Saw Coming

Arbitrum (ARB) has been one of the more sluggish performers in recent months, even as Ethereum (ETH) holds its ground in broader market trends. However, a new chart shared by crypto analyst Sjuul from AltCryptoGems suggests that ARB price could be entering a possible bullish phase, if it can reclaim a key technical level. Sjuul mentioned that this setup could turn into a strong upward move, especially if Ethereum begins a sustained rally.
Moreover, Sjuul pointed out that ARB has been underperforming for some time. He noted that a reclaim of a previously broken support could shift momentum. The analyst added that with ETH potentially gaining strength, tokens like ARB, closely tied to Ethereum’s scaling, could benefit as market interest rotates toward Layer-2 projects.
What you'll learn 👉
Rounded Bottom Pattern Suggests Accumulation Phase Ending For ARB Price
A review of the daily ARB chart reveals the formation of a rounded bottom. This pattern is often viewed as a potential reversal setup. It reflects a transition where selling pressure gradually declines and is met with renewed buyer interest. On the current chart, Arbitrum price appears to be nearing the breakout area that could complete the structure.
The key price level under observation is $0.466. This zone acted as a previous support before flipping into resistance during ARB’s decline in early 2025. A decisive move above this area would suggest buyers are regaining control and may attract increased trading interest in the near term.
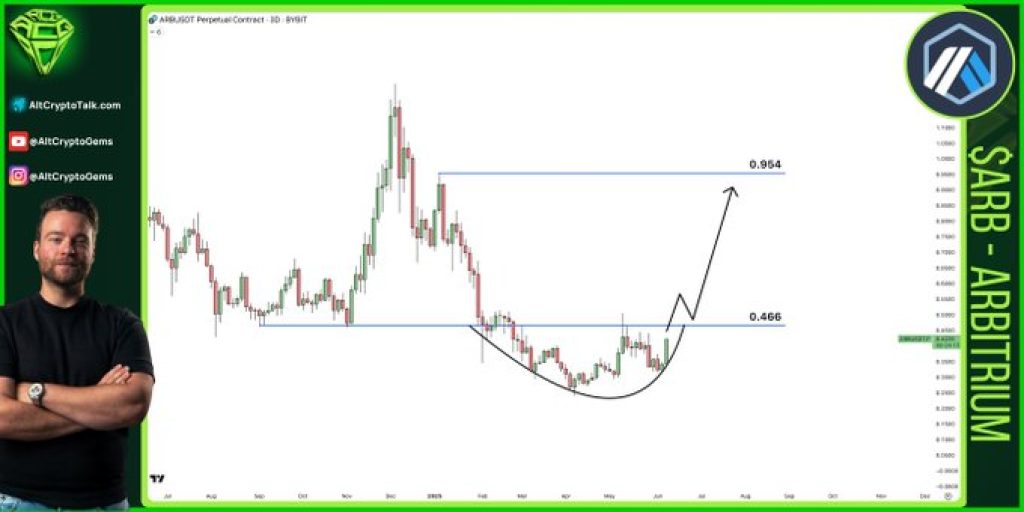
Arbitrum Breakout Target Points Toward the $0.954 Zone
If ARB price breaks above $0.466 with volume support, the next resistance level is located around $0.954. This zone served as a high point during the early-year rally before the price retraced. It remains a key technical level in the current recovery attempt.
The Arbitrum chart shows a sequence of higher lows leading into the $0.466 resistance, suggesting growing pressure from buyers. No major breakdowns have occurred in the current structure, giving this formation the potential to evolve into a bullish continuation if confirmed by price action.
Read Also: How Much Will XRP Be Worth If Ripple Handles 15% of SWIFT Volume?
Furthermore, the nearest support area is identified between $0.37 and $0.41. This zone forms the base of the rounded bottom and serves as the lower boundary of the current range. Holding this area would help preserve the bullish setup. A failure to reclaim $0.466, however, would likely lead to more sideways movement or a retest of the lower zone.
Moreover, if Ethereum gains momentum, as suggested in the original post, correlated assets like ARB may see renewed strength. Traders and analysts are closely watching whether ARB price can complete this technical reversal and establish a short-term trend shift.
Subscribe to our YouTube channel for daily crypto updates, market insights, and expert analysis.

We recommend eToro
Wide range of assets: cryptocurrencies alongside other investment products such as stocks and ETFs.
Copy trading: allows users to copy the trades of leading traders, for free.
User-friendly: eToro’s web-based platform and mobile app are user-friendly and easy to navigate.