SUI is drawing increased attention as price action shows early signs of a potential recovery. Two separate analyses from Michaël van de Poppe and Sjuul of AltCryptoGems indicate possible strength returning to the asset after a prolonged downtrend. At writing, SUI price is trading at $2.56, up 5.20% over the past day. Its trading volume has also climbed by 22%, reflecting a possible shift in momentum.
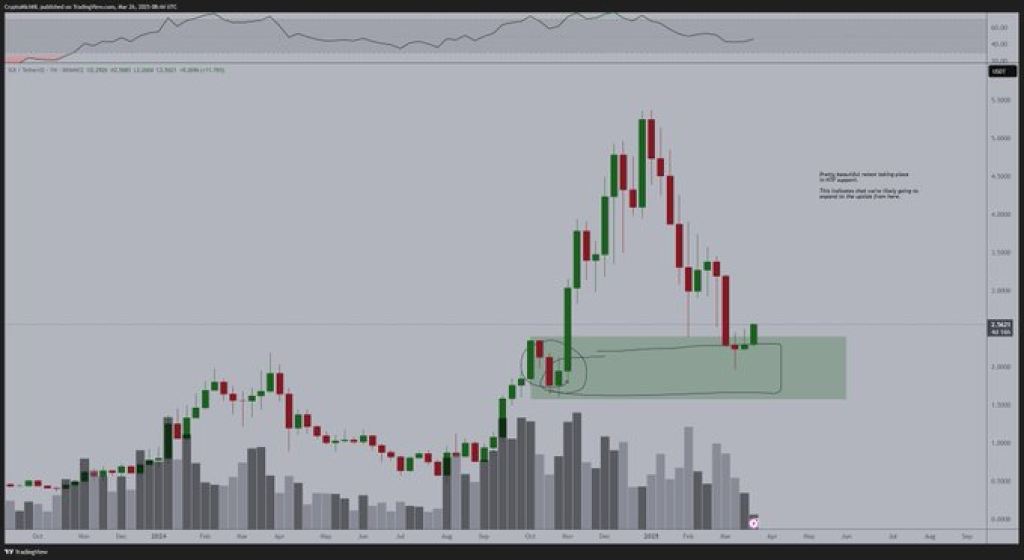
Crypto expert Michaël van de Poppe shared a chart accompanied by a bullish statement on X, noting that the price of SUI has undergone a strong retest and may be entering an uptrend. His chart, based on the weekly timeframe, shows that the price has returned to a previous consolidation zone that had served as resistance during 2023’s rally.
That same zone has now acted as support, with SUI price reacting positively. Several green candles have begun to form within this area, showing early buying interest. Volume has remained stable during this period, which can often suggest accumulation by market participants. The RSI indicator sits near the 40 level, not yet oversold but approaching conditions where reversals often occur.
What you'll learn 👉
SUI Price Weekly Structure Shows Signs of Trend Reversal
Van de Poppe’s analysis shows a complete cycle: strong accumulation, a sharp rally, correction, and now a potential retest for a new leg higher. The zone price it is currently interacting with has historically played a key role in previous moves, further reinforcing its relevance.
Volume behavior during the pullback was lower compared to the rally, often interpreted as reduced selling pressure. If this area continues to hold and the RSI turns upward, the probability of a renewed bullish phase may increase, based on historical chart behavior.
Analyst Sees SUI Price Breakout from Medium-Term Resistance
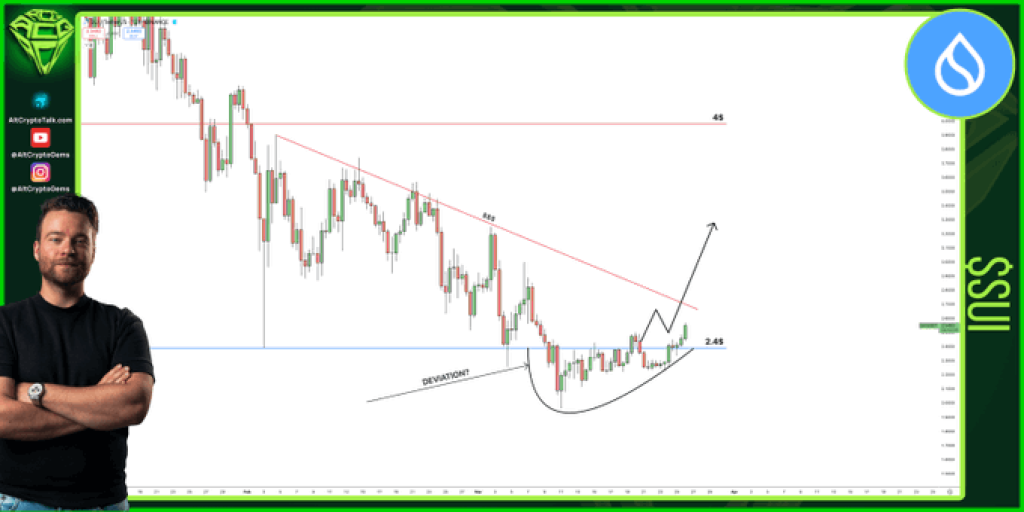
Sjuul from AltCryptoGems also shared an analysis on X, pointing to a bullish market structure on the lower timeframe. His chart illustrates a key breakout above the $2.45 support level, which had previously been lost. The SUI price reclaimed this zone and continued higher, forming a cup-shaped pattern often associated with accumulation.
The chart includes a downtrend resistance line that has now been broken. This change marks the shift from lower highs to a potential uptrend with higher lows. The deviation below $2.45 followed by a reclaim is commonly viewed by traders as a failed breakdown, which can attract new buyers.
SUI Market Outlook with Key Levels in Focus
These analysts independently point to structural shifts in SUI’s price chart. Van de Poppe uses the weekly timeframe, while AltCryptoGems focuses on the medium term. The shared view between both is the reclaim of key support levels and the break of prior resistance trends.
Price holding above $2.45 may now serve as the confirmation level in the short term. Any sustained move above this point, coupled with increasing volume, could open the door for further gains. The next potential resistance target, as marked in AltCryptoGems’ chart, lies near the $4.50 zone.
These developments have emerged as trading activity increases and technical indicators begin to reflect strength. Traders and investors are now watching closely for confirmation that the trend shift may continue.
Read Also: Ripple’s CLO Drops Final Update on XRP vs SEC Case Ever: ‘That’s all folks!’
Subscribe to our YouTube channel for daily crypto updates, market insights, and expert analysis.

We recommend eToro
Wide range of assets: cryptocurrencies alongside other investment products such as stocks and ETFs.
Copy trading: allows users to copy the trades of leading traders, for free.
User-friendly: eToro’s web-based platform and mobile app are user-friendly and easy to navigate.