Crypto analyst Satoshi Flipper shared with X his followers that Solana’s price is getting close to a crucial level that might result in a breakout from a consolidation pattern that has been in place for a year. A symmetrical triangle, which has held the price in check for the majority of 2024, is also visible on Solana’s daily chart.
The analyst’s observations indicate that SOL may be poised for a significant upward rise if it breaks out of the current configuration. The cryptocurrency community is closely monitoring any signs of a potential bullish rally as the price keeps testing resistance levels.
Doge2014 raises 500K in days celebrating Dogecoin. Make potentially big profits and get in on exclusive airdrop!
Show more +What you'll learn 👉
Solana Chart Analysis: Symmetrical Triangle Pattern Suggests Potential Breakout
The SOL chart displays a symmetrical triangle formation that indicates a consolidation period as the price continuously oscillates between two convergent trendlines. Since it frequently results in a clear breakout as the price gets closer to the triangle’s apex, this formation is a common indicator of impending volatility.
With the price of Solana frequently testing the triangle’s support and resistance levels, this pattern has been evolving throughout 2024. The price has recently inched closer to the upper trendline, indicating potential momentum for an upward break.
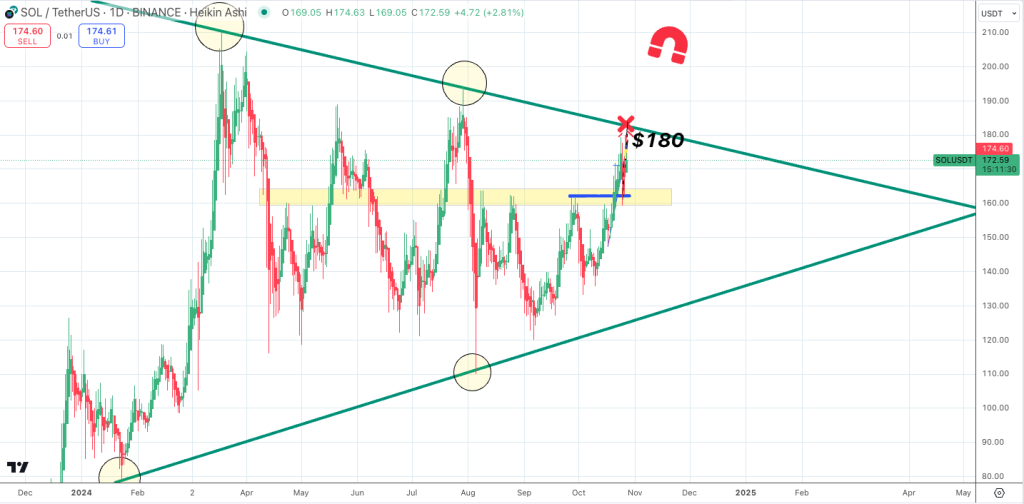
The analyst emphasized that if SOL breaches this upper resistance, it could initiate a “parabolic” movement, which suggests rapid price acceleration. The triangle pattern’s longevity enhances the breakout potential, as extended periods of consolidation generally lead to more substantial market moves.
Key Resistance and Support Levels in Focus
The upper trendline resistance of Solana, which is situated at about $180, is a crucial milestone that has been tried multiple times. An upward trend may be about to start if the SOL price closes above this resistance.
On the downside, the lower trendline acts as a strong support level, helping prevent major declines. Additionally, a yellow-highlighted region just below the current price marks an established support zone from previous consolidation phases, indicating a possible area of renewed buying interest if the price were to dip.
Read Also: Here’s Why Raydium (RAY) and NEIRO Might Be Gearing Up for a Breakout
Analyst’s Bullish Sentiment on SOL’s Future Movement
Satoshi Flipper highlighted the possibility of a parabolic rally if Solana successfully breaks above the triangle’s resistance. The term “parabolic” hints at the potential for a rapid surge in price, which aligns with the typical behavior observed in symmetrical triangles.
This bullish outlook is strengthened by the fact that SOL’s price has spent a considerable portion of 2024 consolidating within this formation, suggesting a buildup of momentum that could release strongly upon a breakout.
While the chart does not display specific momentum indicators, the Heikin Ashi candles indicate bullish strength as green candles approach the resistance level. The symmetrical triangle is nearing its apex, implying that a breakout could be imminent in the coming weeks. The prolonged consolidation and narrowing of the triangle support the possibility of an explosive move, especially if buyers push the price above $180.
Subscribe to our YouTube channel for daily crypto updates, market insights, and expert analysis.
We recommend eToro
Wide range of assets: cryptocurrencies alongside other investment products such as stocks and ETFs.
Copy trading: allows users to copy the trades of leading traders, for free.
User-friendly: eToro’s web-based platform and mobile app are user-friendly and easy to navigate.


