
Mantra’s price has moved noticeably in recent days, with chart patterns hinting at a potential change in direction. The coin broke upward out of a downward wedge formation, creating a brief price jump. Now, traders are wondering if this rise will continue or if prices might fall soon.
Market analyst Crypto_Jobs shared insights on X (formerly Twitter), stating, “$OM I think that’s another top to be shorted here .” This observation aligns with technical analysis that suggests the OM’s price has reached a key resistance level. As investors assess the next move, market sentiment remains cautious.
What you'll learn 👉
Mantra Technical Analysis: Resistance and Potential Reversal
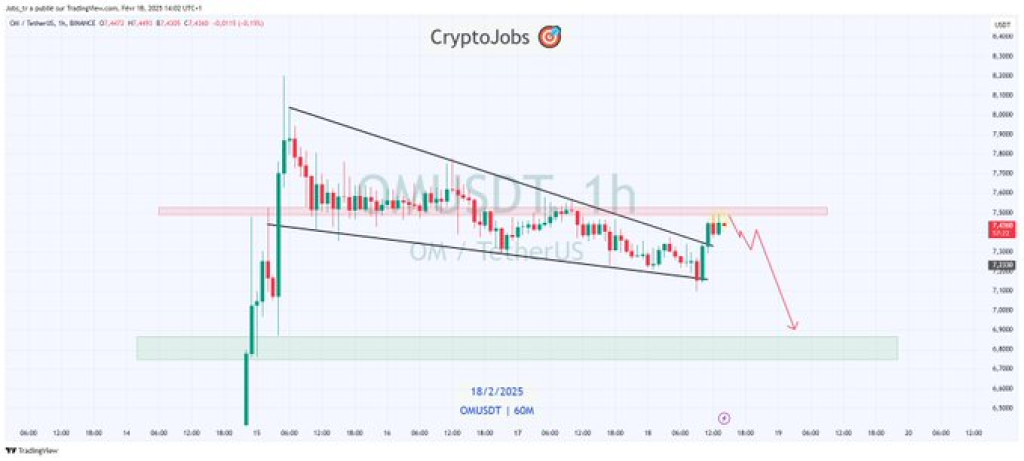
A review of the OM chart indicates that the price recently tested a resistance zone around $7.38-$7.50 after breaking out of the descending wedge. Despite the breakout, the price struggled to maintain momentum, facing rejection at this key level. The inability to sustain the above resistance suggests possible exhaustion among buyers.
On the downside, support is identified in the $7.00-$7.10 range, an area that previously served as a strong demand zone. If selling pressure increases, OM’s price could retest this support level soon. The chart also indicates a potential bearish retest, which could open opportunities for short traders.
Bearish Signals and Short Trading Potential
Traders monitoring OM’s rice action are considering the likelihood of a pullback, especially if the token fails to reclaim resistance. The rejection at $7.40 suggests that bears are gaining control, increasing the probability of a downward move. If the price starts declining from current levels, traders may look for short positions targeting the $7.00 support zone.
The red arrow drawn on the chart further supports the possibility of a move lower. A failed attempt to push above resistance would confirm a bearish structure, reinforcing the case for a potential decline. Investors are advised to observe whether the price forms a lower high, which could validate the downward trajectory.
Read Also: Why is Maker (MKR) Price Pumping?
Market Sentiment and OM Price Future Outlook
With Mantra showing signs of hesitation near resistance, market participants remain divided on its next move. While the breakout from the descending wedge initially appeared bullish, the resistance rejection introduces uncertainty. If the price struggles below $7.40, a corrective move toward $7.00 remains likely.
As traders react to these signals, short-term volatility could increase. Those looking for confirmation will be watching for further rejection signs or a breakdown below key levels. The coming sessions will be decisive in determining whether OM’s price maintains its bullish momentum or succumbs to selling pressure.
Subscribe to our YouTube channel for daily crypto updates, market insights, and expert analysis.

We recommend eToro
Wide range of assets: cryptocurrencies alongside other investment products such as stocks and ETFs.
Copy trading: allows users to copy the trades of leading traders, for free.
User-friendly: eToro’s web-based platform and mobile app are user-friendly and easy to navigate.