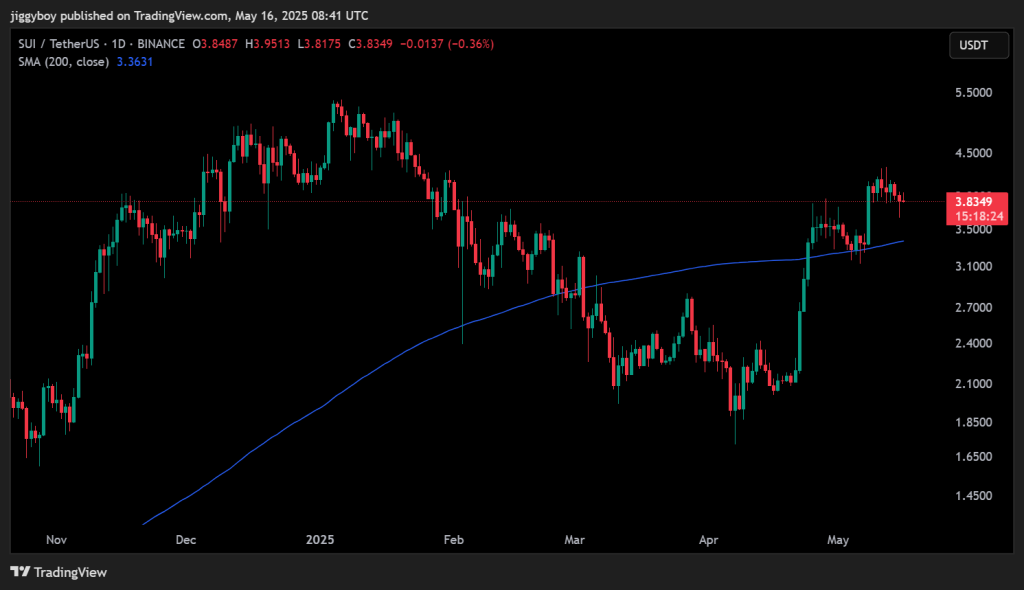
SUI price has seen a strong recovery since mid-April, drawing increased attention as it climbed back above the 200-day moving average. The token, trading at $3.84 at writing, is up nearly 2% on the day, with trading volume also rising by 35.48%. After a long downtrend earlier in the year, this latest breakout has raised a familiar question: is it too late to buy SUI, or is the rally just beginning?
What you'll learn 👉
What the Chart and Indicators Are Saying
SUI price chart shows a major trend shift. The token dropped from its peak near $5.50 in January down to around $1.50 by early April. However, the structure reversed over the past month, with SUI forming higher lows and reclaiming the 200-day simple moving average (SMA), which currently sits around $3.36.
Since then, the SUI price has surged past the $3.50 zone, reaching a local high near $4.50 before consolidating. This consolidation now appears to be holding above the 200-day SMA, suggesting a new support level has formed. The $3.36–$3.40 range remains the most critical zone for bulls to defend, while resistance around $4.50 and $5.00 remains in play if the rally continues.

Looking at daily technical indicators, momentum still favors the bulls.
- MACD is positive at 0.327, showing upward pressure.
- Ultimate Oscillator is at 55.24, indicating momentum across multiple timeframes remains in buy territory.
- ROC shows a 12.07% increase over recent days, backing the bullish structure.
- Bull/Bear Power is slightly positive at 0.1681, showing buyers still hold control.
- Only the CCI, at 39.48, sits in neutral territory, showing that price action is stabilizing without strong overbought or oversold signals.
| Indicator | Value | Interpretation |
| MACD (12,26) | 0.327 | Bullish, positive momentum above zero line |
| CCI (14) | 39.4873 | Neutral, cooling off from recent highs |
| Ultimate Oscillator | 55.245 | Bullish, above midline |
| Rate of Change (ROC) | 12.077 | Strong upside movement in recent sessions |
| Bull/Bear Power (13) | 0.1681 | Slightly bullish, buyers remain in control |
SUI Price Forecast
If SUI maintains its position above the 200-day SMA and breaks through the $4.50 resistance, a move toward $5.00–$5.50 is likely. This would put the token back near its previous highs from January. However, if SUI price fails to hold above $3.36, it could revisit support levels at $3.00 or even $2.10–$2.40 in a deeper retracement.
So, is it too late to buy SUI?
Not quite. While the biggest gains from the $1.50 range may be behind, the current structure suggests potential for more upside, especially if bulls manage to push through key resistance levels. The trend has turned bullish, and volume is rising, but confirmation of continuation is still needed. This isn’t a late-stage rally, but it’s no longer a hidden opportunity either. Traders watching for the next breakout will want to see price and volume align above $4.50 before jumping in.
Read Also: Why Kaspa (KAS) Could Gain 60% by June – Chart Signals Say So
Subscribe to our YouTube channel for daily crypto updates, market insights, and expert analysis.
We recommend eToro
Wide range of assets: cryptocurrencies alongside other investment products such as stocks and ETFs.
Copy trading: allows users to copy the trades of leading traders, for free.
User-friendly: eToro’s web-based platform and mobile app are user-friendly and easy to navigate.


