Optimism (OP) has had quite a wild ride in 2025. After crashing down to around $0.52 in April, it bounced back fast, climbing close to $0.95. But that rally didn’t last, OP price has since pulled back and is now trading at $0.8315, up about 3.28% over the past day.
With trading volume jumping over 15%, a lot of eyes are back on OP. The big question? Is this just a temporary bounce, or is something bigger brewing in the background? Traders are digging into the charts and indicators to find out.
What you'll learn 👉
What the Chart and Indicators Are Saying
The Optimism chart shows a long-term downtrend still in play. The token peaked around $2.70 in January 2025 before sliding steadily downward. The 200-day simple moving average (SMA), currently at $1.383, has been trending lower, reinforcing the bearish structure.
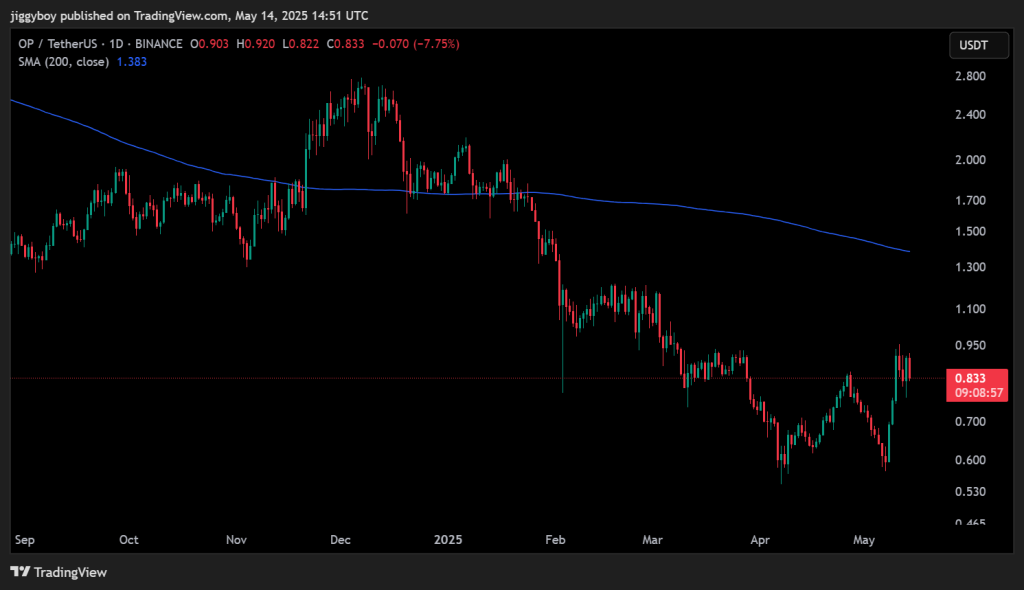
That said, the recent price action offers some hope for bulls. After hitting its lowest point of the year near $0.52, OP price bounced sharply to test resistance just below $1.00. It failed to break through and has since pulled back to the $0.83 range. Despite the rejection, the current zone between $0.70 and $0.83 appears to be holding as a support base.
Short-term momentum has also picked up, with daily indicators pointing to growing buyer interest.
What the Indicators Are Telling Us
Five major indicators are flashing bullish signals:
| Indicator | Value | Interpretation |
| MACD | 0.035 | Bullish crossover, momentum turning positive |
| CCI | 97.86 | Strong bullish zone, just below overbought |
| Ultimate Oscillator | 58.57 | Bullish momentum across timeframes |
| ROC | 14.27 | Strong upside move over past 14 days |
| Bull/Bear Power | 0.166 | Buyers holding control near current levels |
These values suggest bulls are starting to regain control. However, the resistance zone between $0.95 and $1.00 has rejected the price twice in May, making it a key breakout level to watch.
Read Also: JasmyCoin (JASMY) vs. Stellar (XLM): Where Should You Put $2,000 Right Now?
Optimism (OP) Price Forecast
If OP holds the $0.70 to $0.73 support and breaks above $1.00 with strong volume, it could target $1.10 to $1.15 next. A more bullish scenario could see it test the 200-day SMA at $1.38.
On the downside, failure to hold above $0.70 may lead to a retest of the $0.55 zone, and a break below that would expose new yearly lows.
So, is it too late to buy OP?
Not exactly. While the token has already rebounded from its bottom, it’s still trading below key resistance and far from its early 2025 highs. It may not be a FOMO moment, but OP price could still offer an opportunity, especially if it confirms a trend reversal above the $1.00 mark. For now, the token remains in a wait-and-see zone, where both bulls and bears are testing their strength.
Subscribe to our YouTube channel for daily crypto updates, market insights, and expert analysis.

We recommend eToro
Wide range of assets: cryptocurrencies alongside other investment products such as stocks and ETFs.
Copy trading: allows users to copy the trades of leading traders, for free.
User-friendly: eToro’s web-based platform and mobile app are user-friendly and easy to navigate.