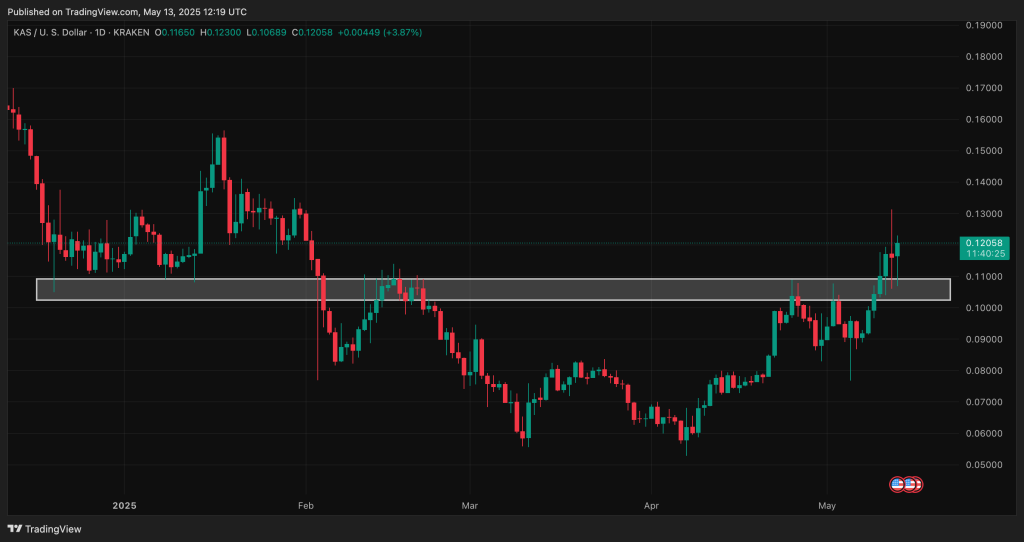
Kaspa (KAS) has jumped nearly 50% in the past two weeks. This rally helped KAS price break past a stubborn resistance zone between $0.09 and $0.10. The level has been capping the upside for over three months.
Kaspa price has officially broken through that zone and is now trading above it, currently holding around $0.122. That KAS breakout marked a return to a crucial area that historically acted as both support and resistance. And now, as long as Kaspa holds above that zone, it could serve as a fresh launchpad.
Even after the Crescendo upgrade (which many expected would boost momentum), the Kaspa price remained stagnant for weeks. Some even said the upgrade was already priced in. But now, with the technical picture shifting, it’s worth asking the big question: is now a good time to buy Kaspa?
What you'll learn 👉
Kaspa Price Breakout: What the Indicators Are Saying
Let’s break down what some of the most reliable technical indicators are saying, based on current data from Investing.com. These tools give us a snapshot of market momentum, volatility, and buying strength.
- RSI (Relative Strength Index 14): Sitting at 70.8, RSI suggests KAS is currently in overbought territory, but not aggressively so. RSI measures the speed and change of price movements, and readings above 70 often mean there’s strong bullish momentum.
- STOCH (Stochastic Oscillator 9,6): With a value around 56.56, this oscillator is still showing bullish signs. It compares a particular closing price of KAS to a range of its prices over time, signaling that KAS has room to grow.
- MACD (Moving Average Convergence Divergence 12,26): Currently at 0.009, this buy signal reinforces that bullish momentum is in place. MACD tracks trend direction and potential reversals.
- CCI (Commodity Channel Index 14): The CCI value is 161.87, which is firmly in bullish territory. It means KAS is trading well above its average price, indicating upward pressure.
- ATR (Average True Range 14): The ATR is 0.0094, suggesting high volatility. This doesn’t tell us if price will go up or down, but it confirms that large price swings are happening.
- Ultimate Oscillator: At 66.58, it indicates buyers are gaining strength. This tool blends short, medium, and long-term price action to spot momentum shifts.
- ROC (Rate of Change): Sitting at 37.64, ROC shows that KAS is moving up fast, a strong sign of bullish acceleration.
- Bull/Bear Power (13): With a value of 0.0237, this tool is in the green too, showing that bulls currently have control.
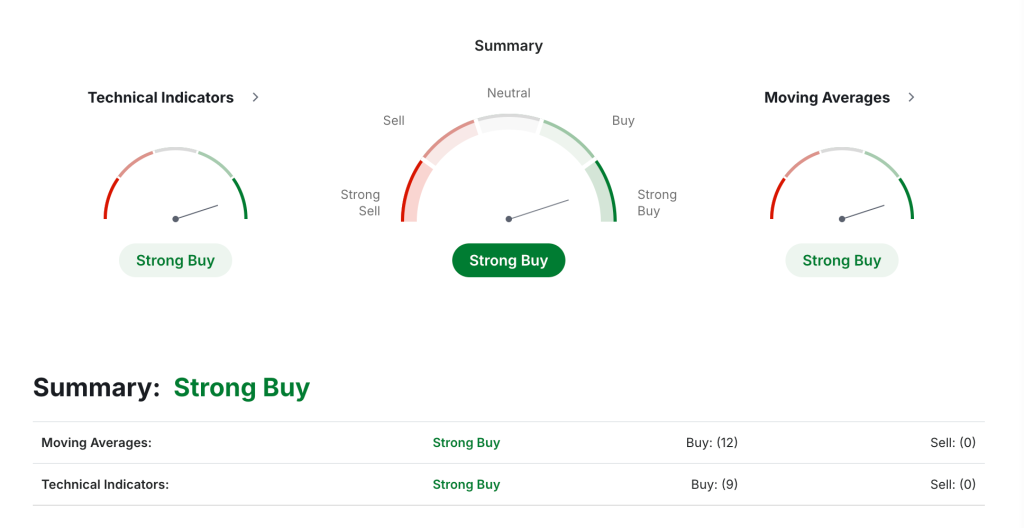
What the Moving Averages Say About KAS Price
Now let’s take a look at how Kaspa is performing relative to its key moving averages.
- MA20 and MA50: Both of these short-term moving averages are flashing buy signals. With KAS trading well above both the 20-day and 50-day averages, the near-term trend remains bullish.
- MA100 and MA200: These longer-term moving averages also support a bullish outlook. KAS price has reclaimed levels above its 100-day and 200-day moving averages, a classic sign of a strong breakout that’s gaining long-term momentum.
With these averages all lined up in bullish territory, Kaspa is technically in what’s known as a “golden zone”, when short, medium, and long-term indicators all align to support upward continuation.
Reads Also: Onyxcoin (XCN) Price Set to Break Out This Week, Analyst Warns: “We’re Days Away”
So, Is It Too Late to Buy Kaspa?
The short answer? Not necessarily.
KAS has broken above a major resistance that previously rejected price multiple times. This flip from resistance to support is a strong sign of trend continuation. If Kaspa price stays above the $0.10 to $0.105 zone, bulls could push toward higher targets, possibly testing $0.14 and beyond in the coming weeks.
The indicators back that idea too. Momentum is strong, moving averages are aligned, and volatility is creating room for big moves. Of course, no asset goes straight up forever, and some short-term pullbacks are always possible. But from a technical perspective, this rally looks more like the beginning of something bigger than the end of a run.
So if you’ve been sitting on the sidelines, this might not be the worst time to start easing in. Just keep an eye on that $0.10 level, as long as Kaspa stays above it, the bulls remain firmly in control.
Subscribe to our YouTube channel for daily crypto updates, market insights, and expert analysis.

We recommend eToro
Wide range of assets: cryptocurrencies alongside other investment products such as stocks and ETFs.
Copy trading: allows users to copy the trades of leading traders, for free.
User-friendly: eToro’s web-based platform and mobile app are user-friendly and easy to navigate.