Crypto market developments have raised concerns about the next Bitcoin direction. BTC has been dropping in price, and Bitfinex whales are reducing their long positions. This has left many investors wondering whether it’s time to exit the market or if there’s still room for growth. To shed light on this situation, Lookonchain analyzed six key indicators that offer insights into Bitcoin’s current market position and potential future movements. let’s look at their analysis.
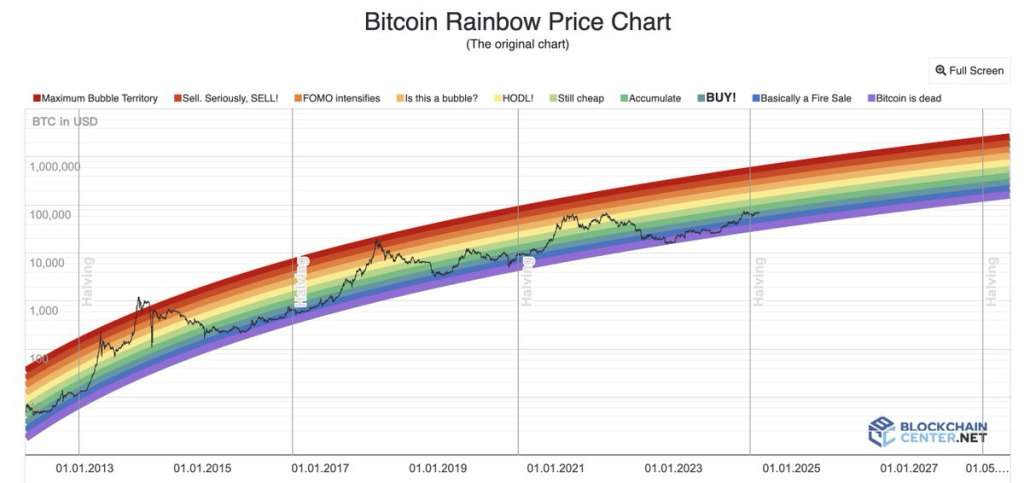
Rainbow Chart: Still in the Buy Zone
The Rainbow Chart, a long-term valuation tool utilizing a logarithmic growth curve, suggests that now is an opportune time to purchase Bitcoin. This indicator provides a broader perspective on BTC’s price trajectory, indicating that despite recent fluctuations, the cryptocurrency hasn’t yet reached its peak valuation.

Relative Strength Index (RSI): Approaching Overbought Territory
The current RSI stands at 69.93, just shy of the overbought threshold of 70. While this suggests that Bitcoin is nearing overbought conditions, it hasn’t quite crossed that line. Historically, an RSI above 70 often signals a potential price correction, while below 30 indicates oversold conditions that may precede an upturn.
200 Week Moving Average Heatmap: Hold and Buy
According to the 200 Week Moving Average Heatmap, Bitcoin’s current price point is in the blue zone. This indicates that the market hasn’t reached its peak, suggesting it may still be a good time to hold existing positions or consider new purchases.
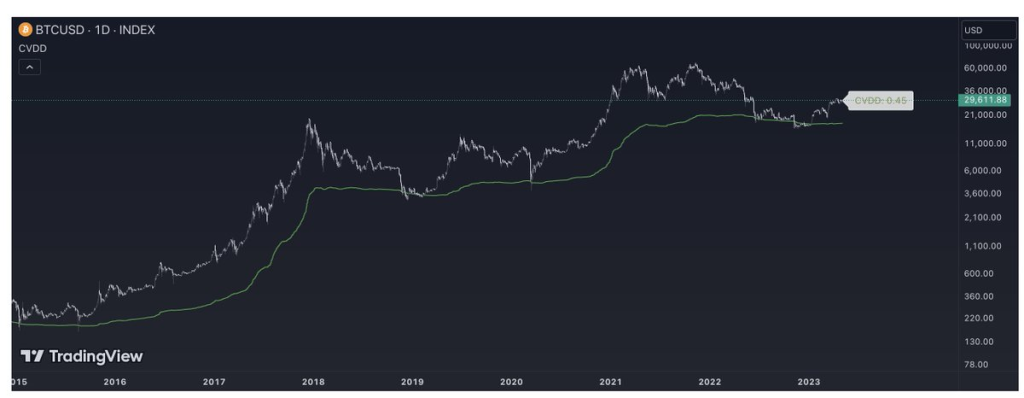
Cumulative Value Coin Days Destroyed (CVDD): Top Not Yet Reached
The CVDD indicator, which helps identify undervalued conditions when Bitcoin’s price touches the green line, currently suggests that BTC hasn’t hit its top. This aligns with the notion that there might still be room for growth in the current market cycle.

Read Also: Notcoin Analysts Predict Continued Bullish Rally for NOT Following Key Breakout, Share Price Targets
2-Year MA Multiplier: Middle Ground
This indicator places Bitcoin’s price between the red and green lines, suggesting we’re in a middle ground. The fact that it hasn’t touched the red line implies that the market top hasn’t been reached, potentially leaving room for further upward movement.
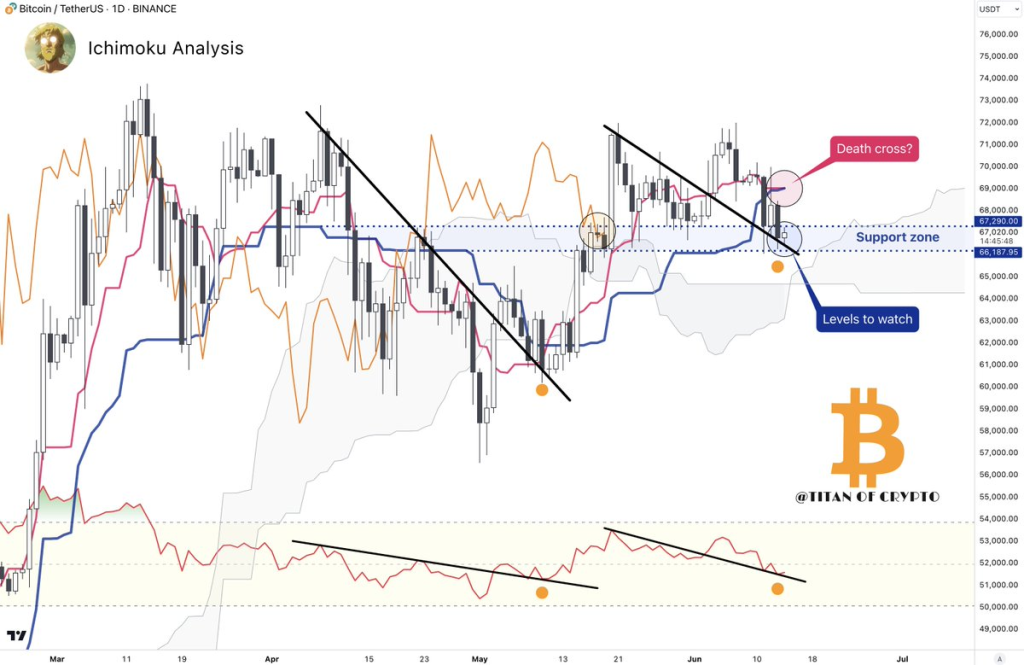
Kumo Cloud and Potential Death Cross
Titan of Crypto (@Washigorira) points out that Bitcoin is currently trading in a support zone, with $66,100 being a crucial level to watch. If this level breaks, the Kumo cloud could serve as the next support. The analyst also notes a potential bounce based on the RSI and price action but cautions about a forming death cross, which could signal a bearish trend if it materializes.
Doge2014 raises 500K in days celebrating Dogecoin. Make potentially big profits and get in on exclusive airdrop!
Show more +
While the recent sell-off by Bitfinex whales and the price drop have caused concern, the majority of these indicators suggest that Bitcoin may not have reached its peak for this cycle.
Subscribe to our YouTube channel for daily crypto updates, market insights, and expert analysis.
We recommend eToro
Wide range of assets: cryptocurrencies alongside other investment products such as stocks and ETFs.
Copy trading: allows users to copy the trades of leading traders, for free.
User-friendly: eToro’s web-based platform and mobile app are user-friendly and easy to navigate.


