Is Injective (INJ) a Dead Coin or the Next 2800% Opportunity? Here’s What The Chart Is Saying
The Injective price has fallen sharply from its previous all-time high, leading some traders to question whether the project has lost its momentum.
However, a recent technical analysis shared by top analyst Crypto Patel suggests that the recent decline may actually represent a typical market reset rather than the end of the project’s growth potential.
According to the analysis, the INJ price has corrected by roughly 95% from its peak, a move that often happens during major crypto cycles.
Such steep corrections usually clear out late buyers and excess liquidity from the market, allowing stronger long-term accumulation to take place. In many cases, this type of reset creates conditions for the next large price expansion once the market structure stabilizes.
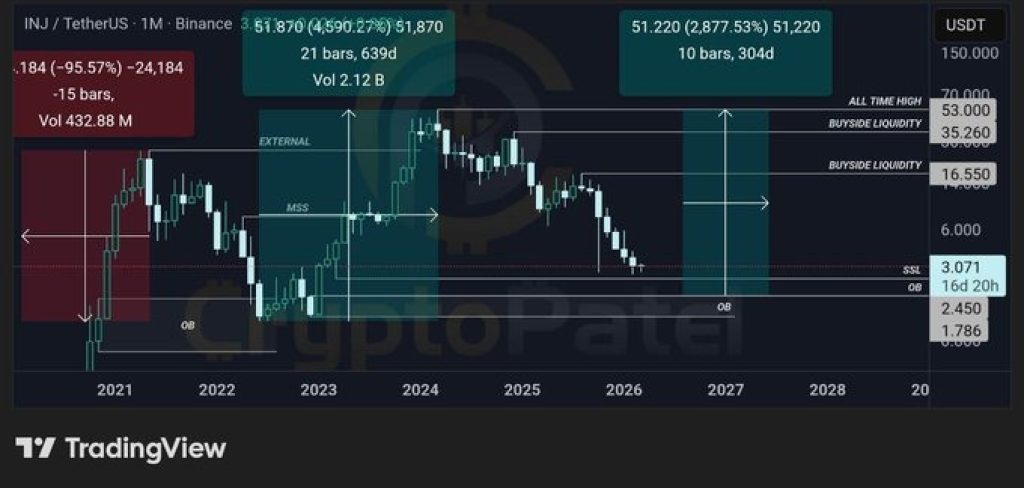
Here’s What The INJ Chart Is Showing
Looking at the monthly timeframe, the chart shows that the INJ price tapped into a monthly order block, which represents a high-timeframe demand zone where institutional buying activity can appear.
These zones are closely watched by traders because they often mark areas where large investors previously accumulated positions.
After reaching this demand zone, the chart reportedly showed a powerful impulsive expansion of around 4500%, suggesting a strong reaction from buyers at that level.
This type of displacement is often interpreted as confirmation that the order block is valid and that significant demand exists in that price region.
The analysis also highlights a Market Structure Shift (MSS) on the macro chart. A structure shift like this can signal that the long-term trend is beginning to change. If this new structure holds and the market continues forming higher lows over time, it could strengthen the case for a larger recovery move.
Liquidity Targets Point to Large Upside Potential For INJ price
If the broader market structure remains intact, the chart suggests several potential upside liquidity targets for INJ in the longer term.
The first key level sits around $16, followed by higher targets near $35 and $53, which correspond to areas where liquidity may exist on the chart.
Achieving those levels from current levels is a potential move of more than 2800%, as per the analysis.
Read Also: AI Predicts Where ADA Price Is Headed Next After Cardano’s Technical Flip
However, the move is said to be a gradual process, and traders are advised to look out for confirmation signals before entering into a trade.
The strategy that is being used in the analysis is one of patience. Waiting for higher lows to be established on a weekly chart is said to be a confirmation of the resumption of bullish momentum.
Also, looking out for a Change in State of Delivery (CISD) on a pullback is said to be a clearer entry point when the market is said to be trending upwards.
For now, however, while the cryptocurrency has indeed experienced a severe correction, the INJ chart does seem to suggest it may be entering a long-term accumulation phase, which may eventually lead to the next major move. As with all technical analysis, it should be noted that such a move is purely speculative, and research should be done before investing.
Subscribe to our YouTube channel for daily crypto updates, market insights, and expert analysis.