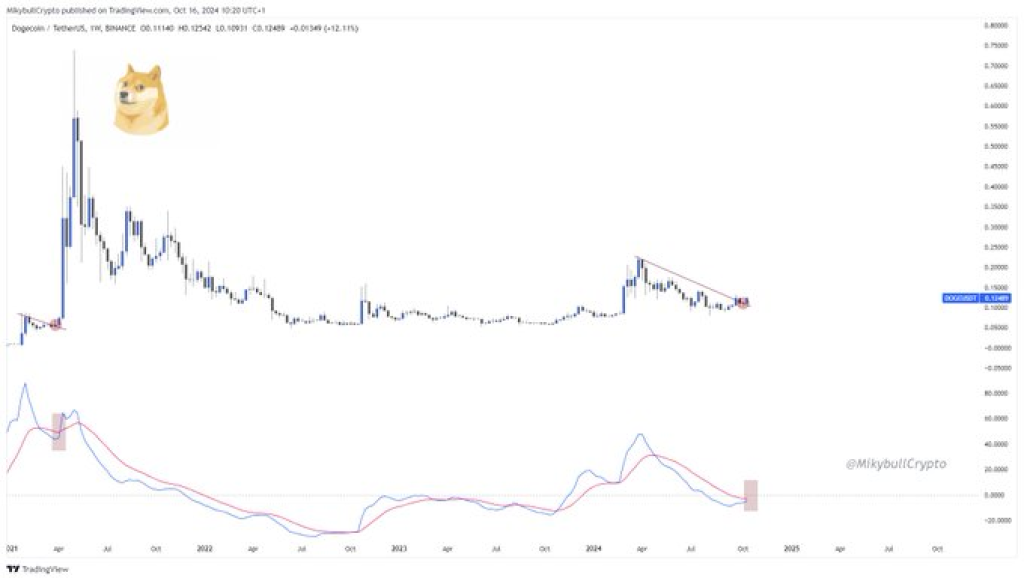
Mikkybull Crypto, a prominent analyst on X (formerly Twitter), revealed to his followers that Dogecoin (DOGE) has been the subject of speculation as it hints at a possible “god candle,” signaling an impending price surge.
The analyst tweeted, “It looks like god candle is coming. Deja vu indeed,” referencing Dogecoin’s previous explosive rally in 2021. As the market awaits a potential breakout, technical indicators suggest DOGE could soon see substantial price movement.
What you'll learn 👉
DOGE Chart Analysis
The Dogecoin price reached an all-time high of about $0.70 in January 2021, thanks to media coverage and social media fervor. But after hitting this high point, Dogecoin’s price dropped sharply.
Then for a long time, its price didn’t change much, staying mostly the same. The market has mainly stayed range-bound, alternating between levels of support and resistance without seeing any significant upward momentum.
Currently, Dogecoin is in a correction phase, gradually falling since mid-2023. The weekly candlesticks indicate a series of lower highs, which signal a continued bearish trend. Despite this, DOGE’s price has held strong near its key support level between $0.055 and $0.06, a critical zone tested several times since 2021.
Doge2014 raises 500K in days celebrating Dogecoin. Make potentially big profits and get in on exclusive airdrop!
Show more +Key Resistance and Support Levels
The descending trendline visible on the DOGE chart reflects the ongoing bearish pressure. This trendline connects the lower highs and presents immediate resistance near the $0.08 to $0.09 range. A breakout above this trendline could confirm a bullish reversal, a move that MikybullCrypto refers to as the potential “god candle.”

On the support side, Dogecoin’s price is holding near the $0.055 to $0.06 zone, which has acted as a crucial base over the past two years. If DOGE holds this support and breaks the descending trendline, the price could rally significantly.
Read Also: Litecoin Primed for Rally: Analyst Eyes LTC Price Surge to $100
MACD Signals and Bearish Momentum
On the weekly DOGE chart, the Moving Average Convergence Divergence (MACD) indicates a negative trend at the moment. The MACD line, which normally indicates a continuation of the downward momentum, has crossed below the signal line. The histogram shows increasing bearish strength, further confirming the existing pressure.
Despite this, any strong buying volume could trigger a trend reversal. A convincing price rally can be similar to the bullish spike that was noted in 2021 if there is a breakout above the $0.09 barrier level.
The market is keeping a careful eye out for indications of heightened purchasing pressure as Dogecoin gets closer to the crucial resistance level. Should DOGE breach the trendline, it might indicate the start of a fresh rising trend, which might result in substantial profits for investors.
Subscribe to our YouTube channel for daily crypto updates, market insights, and expert analysis.
We recommend eToro
Wide range of assets: cryptocurrencies alongside other investment products such as stocks and ETFs.
Copy trading: allows users to copy the trades of leading traders, for free.
User-friendly: eToro’s web-based platform and mobile app are user-friendly and easy to navigate.


