

Chainlink continues to face scrutiny following a prolonged decline against both Bitcoin and the U.S. dollar. A recent tweet by the account ExposeChainLink amplified concerns, which states “Congrats to another new $LINK low against $BTC without any chance of a recovery.”
While emotionally charged, the technical data appears to support the current bearish narrative, with LINK showing no signs of strength across either trading pair.
On the LINK chart, it’s now trading at just 0.0001257 BTC, that’s a drop of over 70% in the last five years. And it’s not just the BTC pair feeling the heat.
LINK price also slid to $13.30 on June 13, losing almost 5% in a single day. Traders are closely monitoring key support levels amid growing pressure on both charts.
What you'll learn 👉
LINK/BTC Pair Extends Multi-Year Downtrend
Chainlink performance against Bitcoin has remained in a consistent downward channel since early 2021. After peaking above 0.0013 BTC, each recovery attempt has failed to reclaim previous highs.
Lower highs have formed repeatedly, while each support zone has broken over time. The pair has now breached the 0.00020 BTC level and is currently in uncharted territory.
No historical support is visible below current levels. The next level to watch is 0.000100 BTC, but so far, price action hasn’t really tested or confirmed it. Resistance is still sitting up at 0.00020 and 0.00030 BTC. Until LINK price breaks out or shows some kind of reversal, it’s still looking weak compared to Bitcoin.
Read Also: Chainlink (LINK) Gearing Up for Major Move: Fundamentals and Chart Say It All
LINK Price Faces Key Breakdown Risk
On the LINK price chart, the price is trading below the 9-day simple moving average, which stands at $14.00. After a failed bounce near $15.50 earlier this month, selling resumed.
The June 13 daily candle closed at $13.30, with printing a wide red body with a lower wick around $12.75. This indicates sellers were clearly in control for most of the session, even if a few buyers showed up near the bottom.
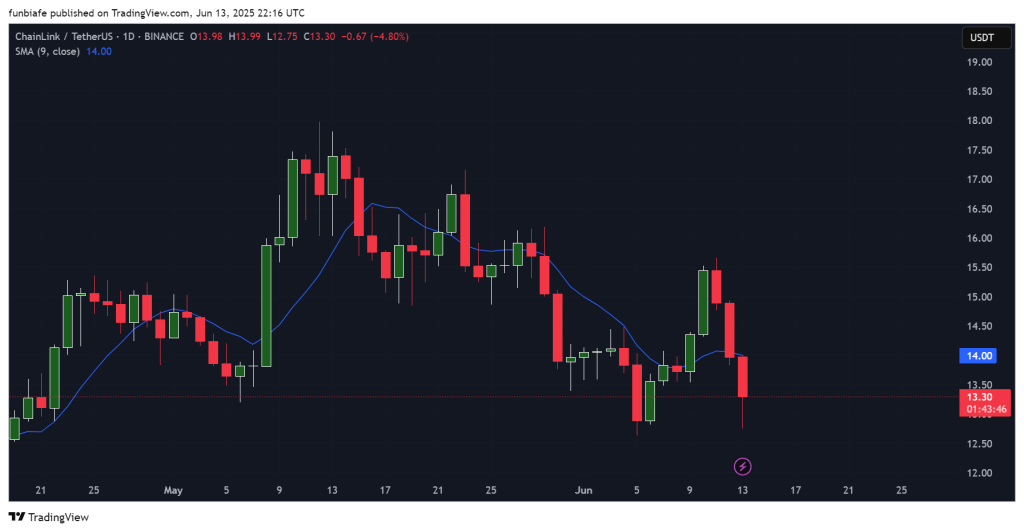
Keep a close eye on the $13.00 and $12.00 support levels. If LINK price drops below $13.00, it could head down towards the $12.00 zone from April.
Resistance is now found at $14.00 and $15.50, both of which rejected price advances in earlier sessions.
Chainlink Structure Remains Bearish on Both Charts
On both the BTC and USDT pairs, the Chainlink structure is displaying a clear bearish structure. The descending trendline from the 2021 high continues to cap price recovery efforts.
No breakout has occurred on the LINK/BTC pair in over two years. On the LINK/USDT chart, each bounce has resulted in a lower high followed by renewed selling.
Unless LINK price reclaims key moving averages and breaks through overhead resistance with volume, current momentum is expected to remain in favor of sellers.
Price structure, trendlines, and volume behavior all reflect a market that continues to trade against the asset.
Subscribe to our YouTube channel for daily crypto updates, market insights, and expert analysis.

We recommend eToro
Wide range of assets: cryptocurrencies alongside other investment products such as stocks and ETFs.
Copy trading: allows users to copy the trades of leading traders, for free.
User-friendly: eToro’s web-based platform and mobile app are user-friendly and easy to navigate.


