The crypto world is having a rough patch right now. The whole market is down, dropping to around $2.29 trillion. People aren’t trading as much either; trading is down about 33.22% from yesterday.
Bitcoin has been on quite a ride lately; it shot up to $73,544 over the past week, which got everyone excited. But then it slipped back down to around $68,323.
One of the main reasons for the market dip today is the shift in political sentiment, with Trump’s odds of winning reportedly dropping against Kamala Harris. This political uncertainty has added to investor caution, causing a pullback in high-risk assets like cryptocurrencies.
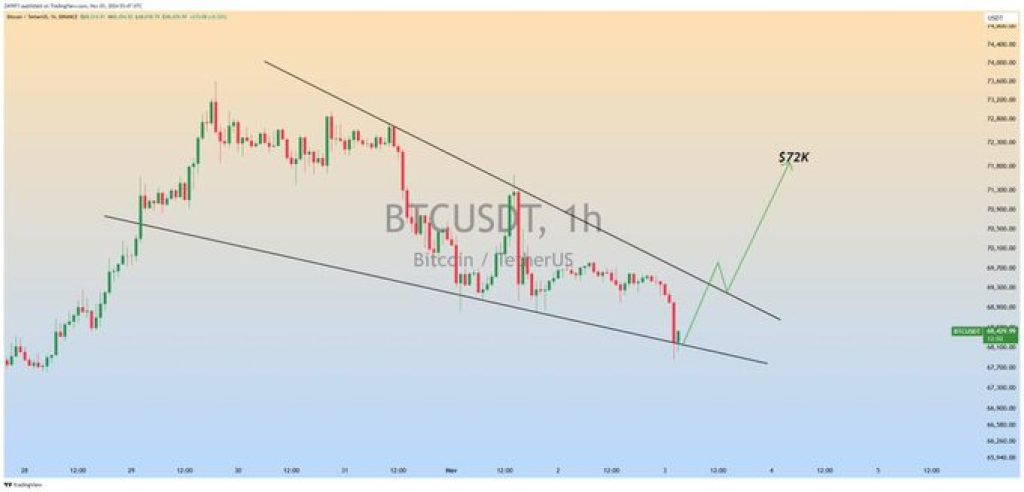
Technical analyst ZAYK Charts shared with his 20.4k on X (formerly Twitter) that Bitcoin (BTC) may be approaching a key turning point as he has noticed a falling wedge pattern in the token’s chart.
Nonetheless, this bullish scenario raises the possibility of a substantial rise in Bitcoin’s price; if a breakout happens, the analyst predicts a possible climb to $72,000.
The behavior of falling wedge patterns, which frequently come before upward reversals in cryptocurrency markets, is consistent with this prediction.
Doge2014 raises 500K in days celebrating Dogecoin. Make potentially big profits and get in on exclusive airdrop!
Show more +What you'll learn 👉
Bitcoin Chart Analysis: Falling Wedge Formation Signals Potential Upside
The analysis by ZAYK Charts highlights a well-defined falling wedge pattern, where Bitcoin’s price has been trending within two downward-sloping lines.
This structure is characterized by converging upper and lower trend lines, indicating that the recent downward momentum might be losing strength. Typically, as price movements compress within this pattern, a breakout could occur, shifting sentiment from bearish to bullish.

The upper boundary of the wedge serves as immediate resistance, while the lower boundary acts as crucial support. Bitcoin’s price has respected these lines, repeatedly testing both levels. Currently, BTC is trading near the lower trend line, which suggests it could be nearing a potential reversal point if support holds steady.
Support and Resistance Zones Key to Breakout Confirmation
In this chart, the lower trend line functions as the primary support zone, which, if maintained, could encourage bullish momentum. Conversely, a breakdown below this level likely invalidates the bullish wedge, signaling further downward pressure.
The upper trend line is the resistance barrier and a close above this line would confirm a breakout, indicating a shift to bullish momentum.
ZAYK Charts emphasizes that this breakout could propel Bitcoin’s price back to its previous high levels of around $72,000. However, the absence of volume data on this chart means that traders should watch for a surge in trading volume, which would help confirm any breakout attempt.
Read Also: Is Solana (SOL) Price Ready for a Breakout? Injective (INJ) Indicator Suggests Potential Reversal
Price Action and Breakout Potential
Bitcoin’s price currently sits near the lower boundary of the falling wedge. Should the support at this level remain intact, BTC could see an upside breakout, aligning with ZAYK Charts’ prediction. The falling wedge pattern is often seen as a reversal indicator, with price movements breaking out of the upper boundary typically driving the asset’s value upward.
As suggested in the tweet, the target price of $72,000 reflects a significant bullish outlook. This price level has previously acted as resistance, meaning a successful breakout could lead to a retest of these highs.
Subscribe to our YouTube channel for daily crypto updates, market insights, and expert analysis.
We recommend eToro
Wide range of assets: cryptocurrencies alongside other investment products such as stocks and ETFs.
Copy trading: allows users to copy the trades of leading traders, for free.
User-friendly: eToro’s web-based platform and mobile app are user-friendly and easy to navigate.


