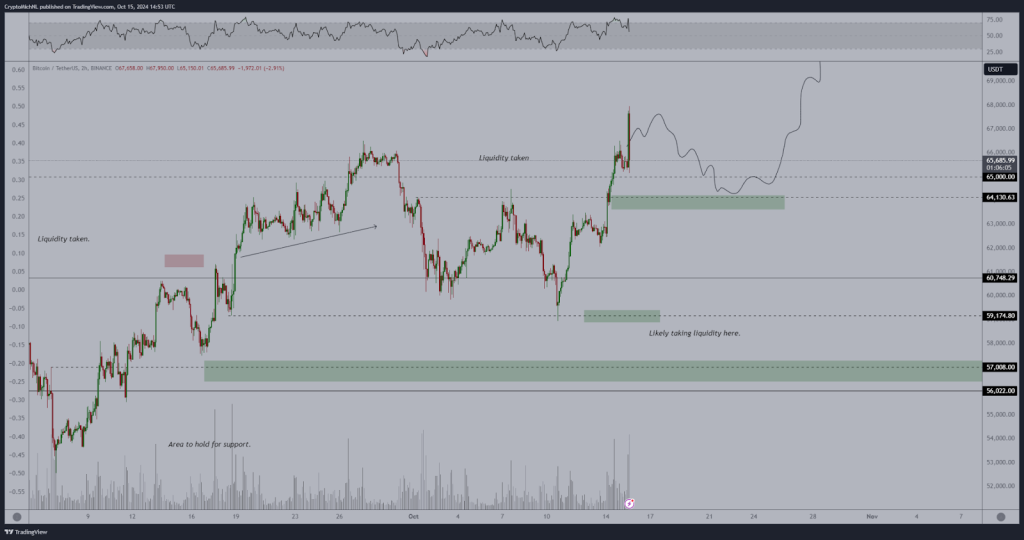
Top analyst Michael van de Poppe updated his followers on the movement of the price of Bitcoin. He emphasized the need for liquidity to be grabbed above recent highs and said that maintaining above the $63.5K–$64K level might result in a new all-time high in November.
This comes as Bitcoin’s price shows signs of cooling off after taking liquidity from key levels.
Doge2014 raises 500K in days celebrating Dogecoin. Make potentially big profits and get in on exclusive airdrop!
Show more +What you'll learn 👉
Bitcoin Price Liquidity Zones and Support Levels
The Bitcoin chart reveals two areas where liquidity was taken: one at a lower price point, and the other near the current peak. This liquidity grab often signifies short sellers being liquidated, which can lead to a temporary price pullback.
After spiking to these levels, Bitcoin’s price appears to be returning downward, reflecting the analyst’s view on a potential retracement before further movement.
The key support area between $63.5K and $64K is now a crucial level to watch. According to Van de Poppe, if Bitcoin holds this level, it could act as a base for a move towards new highs. However, a breakdown below this support might trigger a deeper retracement, with the next zones of interest around $60,748 and $59,174.

Trend Patterns and Breakout Potential
Bitcoin’s recent trend shows an ascending triangle breakout, which occurred in mid-October. After taking liquidity from the highs, the Bitcoin price might be consolidating.
The BTC chart indicates a potential correction into the $64K support zone, with the possibility of a rebound. This aligns with Van de Poppe’s forecast, suggesting Bitcoin could target an all-time high if the $64K support holds.
Volume analysis supports this view, as there was a surge in trading volume when Bitcoin took liquidity from higher levels. High volume at such points often reflects strong market activity, possibly driven by institutional investors or large traders.
Additionally, the Relative Strength Index (RSI), which has a score above 70, indicates that Bitcoin has lately entered overbought territory. This implies that there may have been an overstretch in the price of Bitcoin, which caused the present decline. Traders are now monitoring the RSI for signs of a potential bounce, as the current consolidation phase unfolds.
Read Also: Solana (SOL) Could See Double-Digit Decline If Price Closes Below Key Resistance Today
Bitcoin Price Outlook for November
As Bitcoin hovers around key support levels, traders are watching whether it can maintain the $63.5K to $64K range. Should this area hold, Bitcoin could rally toward an all-time high by November, as predicted by Van de Poppe. Conversely, failure to maintain this support might open the door for a deeper correction, targeting lower liquidity zones.
Finally, with Bitcoin’s price action at a pivotal point, the coming days could prove crucial in determining whether a breakout or correction is next in line. Traders are encouraged to monitor these levels closely.
Subscribe to our YouTube channel for daily crypto updates, market insights, and expert analysis.
We recommend eToro
Wide range of assets: cryptocurrencies alongside other investment products such as stocks and ETFs.
Copy trading: allows users to copy the trades of leading traders, for free.
User-friendly: eToro’s web-based platform and mobile app are user-friendly and easy to navigate.


