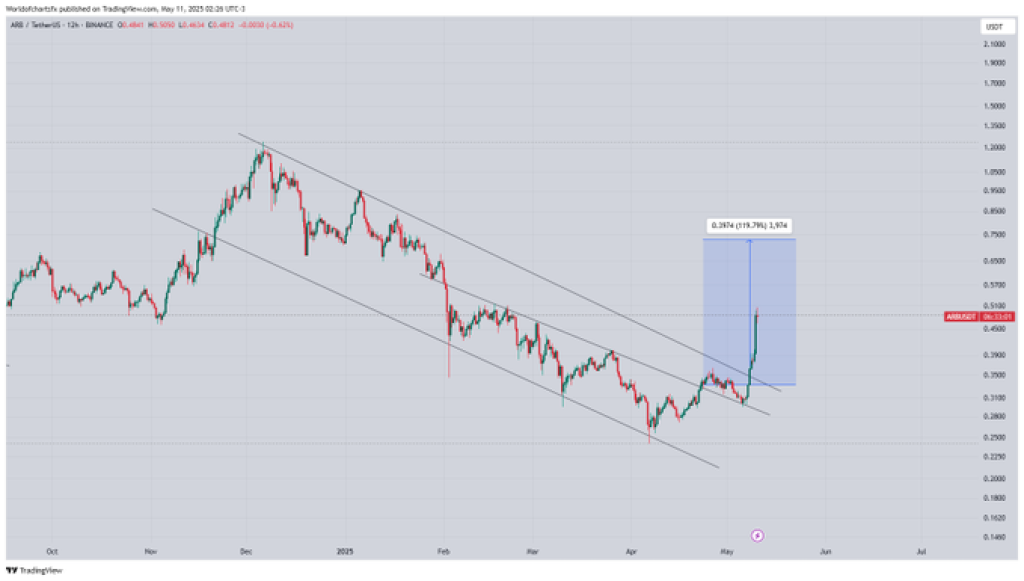
Arbitrum is back in the spotlight after breaking out of a long downtrend. The price is climbing quickly, and traders are taking notice. ARB is Ethereum’s layer 2, and it often moves in sync with ETH, so with Ethereum price gaining momentum lately, it’s no surprise ARB is starting to follow. Top analyst World Of Charts pointed out on X that ARB price has broken through several resistance zones and is now up more than 50% since the breakout.
At writing, ARB is trading around $0.4781, showing a 25% gain over the past day. Trading volume has jumped by 192%, which shows strong interest from buyers. With this kind of momentum and clear technical signals on the chart, many are now watching closely to see if ARB could be heading for that $1 milestone.
Read Also: XRP Price Flashes Buy Signal After Breaking Out, Eyes $3 Run
What you'll learn 👉
ARB Price Strong Breakout from a Downtrend
Arbitrum was moving downward in a channel pattern on the 12-hour chart since late 2023. The price kept making lower peaks and lower valleys, showing that sellers were in control for a long time. But now, that direction has changed. In early May, the Arbitrum price broke out above the upper boundary of the channel, indicating a strong reversal pattern.
This upward move was confirmed by consecutive bullish candles and a rapid increase in buying pressure. The breakout took ARB from around $0.47 to a high of approximately $0.83 in a short timeframe. This breakout matched the projection shared by World Of Charts, who identified the bullish move and noted that the price was advancing towards pre-defined targets.

Arbitrum Resistance Levels Flipped to Support
During its rally, ARB price cleared several important resistance zones. These include the $0.50–$0.53 area near the top of the descending channel and a higher range around $0.60–$0.65, which had acted as resistance in April. These zones are now serving as support.
The first support stands near the $0.63–$0.65 range. A secondary support zone is positioned around $0.58–$0.60. Price holding above these levels may encourage continued bullish movement.
Read Also: Analyst Eyes Big Onyxcoin (XCN) Rally as Price Tests Key Resistance
Furthermore, the tweet by World Of Charts added context to the chart, emphasizing the strength of the rally. The analyst stated that ARB had already delivered over 50% in profits while moving toward its next target. The tweet aligns with the chart showing a 76% surge from breakout lows.
At the same time, trading volume surged 192%, confirming strong participation from buyers. These figures underline the intensity of the breakout and indicate that the market is actively engaging with the asset.
Outlook Based on Arbitrum Chart Structure
Based on the current price structure, if the support near $0.63 holds, ARB could revisit the $0.80–$0.85 area. There is also potential for a retest of $0.90, a zone that aligns with the previous high from March. A move past these levels could open the door to testing $1, which stands as a key psychological resistance.
If, however, the ARB price falls below $0.63, it could retrace to $0.60 or even revisit the $0.53 area that marked the breakout zone. The next few trading sessions will likely determine whether ARB can maintain its momentum or enter a consolidation phase.
Read Also: Analyst Predicts Cardano Price Could Soar to $2.90 as Classic ADA Chart Pattern Repeats
Subscribe to our YouTube channel for daily crypto updates, market insights, and expert analysis.
We recommend eToro
Wide range of assets: cryptocurrencies alongside other investment products such as stocks and ETFs.
Copy trading: allows users to copy the trades of leading traders, for free.
User-friendly: eToro’s web-based platform and mobile app are user-friendly and easy to navigate.


