

Chainlink (LINK) is back on traders’ radar after a tweet from top analyst Crypto Seth pointed out that an $80 price target might not be as far-fetched as it sounds.
At the time of post, LINK price was trading around $13.20, but people are starting to pay closer attention to the bigger picture. Seth also reminded followers that Chainlink still holds its position as the top oracle network in crypto, thanks to its early lead and strong adoption across the industry.
Since peaking near $55 during the 2021 bull run, Chainlink price has been moving sideways. For nearly three years, it’s been stuck in a wide range between about $5 and $35. This long stretch of consolidation has created some clear levels that traders are watching closely.
On the LINK chart, there’s a visible head-and-shoulders setup, with tops showing up in 2021, 2022, and 2024. Unless LINK can break above the $35 level, which acts as the neckline, that pattern could keep price growth limited. On the flip side, the lower end of the range between $5 and $7.50 has been a strong support zone, where long-term holders have stepped in during downturns.
Read Also: Bittensor (TAO) Chart Hints at Next Rally: See How High It Could Go
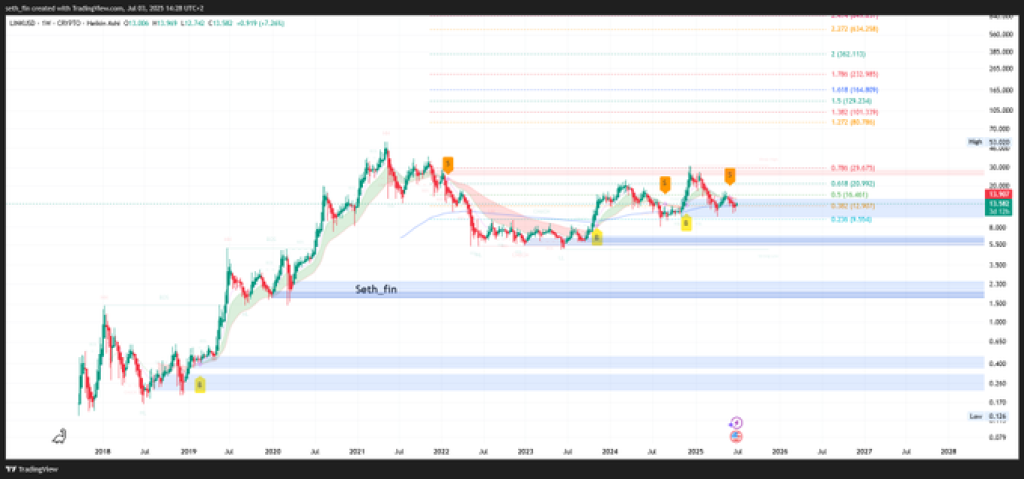
Chainlink Key Resistance Zones and Fibonacci Levels
Several resistance areas exist between $22 and $25, while the primary breakout zone lies above $35. This level also aligns with the 0.618 Fibonacci retracement, making it a zone of technical confluence.
Beyond that, Fibonacci extension targets suggest that $80 is within reach during a strong market expansion. The 1.272 extension level lands near $84, which matches the price point referenced in Crypto Seth’s tweet.
Lower levels around $8.25 and $13.61 represent the 0.236 and 0.382 Fib zones, where price has moved in recent months. For LINK price to shift into a bullish trend, it must reclaim and hold above these mid-range levels, then challenge the macro resistance overhead.
Trend Indicators Reflect Consolidation Phase For LINK Price
Chainlink remains below its long-term exponential moving average ribbon, which currently acts as dynamic resistance. The Chainlink price continues to consolidate under this band, reflecting the asset’s neutral-to-bearish macro momentum. No strong directional trend has emerged, although the structure remains intact.
The chart structure and historical price behavior indicate a potential setup for a breakout, should market conditions improve. Traders continue to monitor this range as LINK trades near its mid-channel zone.
Subscribe to our YouTube channel for daily crypto updates, market insights, and expert analysis.


