Sometimes the market gives subtle hints before a big move. That seems to be the case with SUI, a token that’s been through a steady decline but could now be gearing up for a shift.
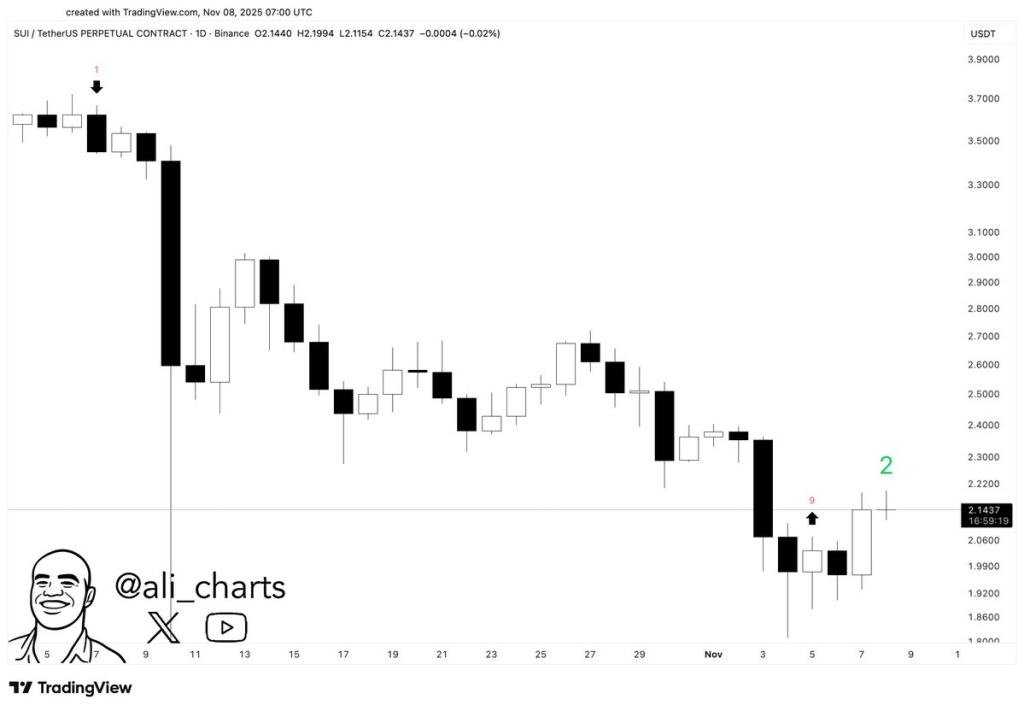
Ali, a respected analyst on X (@ali_charts), posted a chart showing that the same indicator which perfectly signaled a SUI sell setup in October is now flashing “buy.” According to him, the TD Sequential indicator has turned bullish, suggesting the worst may be over for SUI price.
SUI Price Action and the TD Sequential Signal
Back on October 7, the TD Sequential signaled a sell setup, right at the top. SUI token began dropping soon after, sliding from around $3.80 to near $2. The chart Ali shared captures this clearly: the first red arrow marked “1” aligned perfectly with the market top, followed by a deep correction.
Now, the story has flipped. A new green “2” has appeared, showing a potential start of a fresh bullish sequence. Historically, when the TD Sequential prints a buy signal after a long downtrend, it often points to a local bottom. That doesn’t guarantee an instant recovery, but it does mean selling pressure may be easing.

The candle patterns also suggest that buyers are beginning to test control again. If the current momentum holds, SUI price could attempt a recovery above $2.20, aiming for the next resistance around $2.50.
Ali’s post notes how powerful this indicator can be when used correctly, it caught the top before the correction and may now be hinting at a rebound.
Technical Indicators from 5-Hour Time Frame Show Strong Buy
A look at the technical indicators on Investing. com adds more context to this story. On the 5-hour time frame, several tools are signaling growing bullish strength for the Sui token.
| Name | Value | Action |
| RSI(14) | 54.716 | Neutral – Price gaining stability after earlier overselling |
| STOCH(9,6) | 67.201 | Buy – Momentum pushing upward |
| ADX(14) | 22.84 | Neutral – Trend structure still forming |
| CCI(14) | 134.7959 | Buy – Positive price strength emerging |
| Ultimate Oscillator | 65.811 | Buy – Consistent bullish pressure across time frames |
| ROC | 5.377 | Buy – Price showing upward acceleration |
The setup shows a market trying to regain its footing. RSI near 55 suggests SUI is balanced between buyers and sellers. Stochastic and CCI readings indicate growing momentum, while the Ultimate Oscillator confirms strength across multiple periods.
ADX still sits at a moderate 22.84, showing the trend isn’t fully developed yet. That leaves room for a stronger breakout if volume continues to build.
Read Also: Here’s XRP Price If Ripple ETFs Take 5% of the Token Supply
SUI has been consolidating after weeks of declines, and technical readings are now turning optimistic. If the token holds above $2.10 and volume supports the move, it could aim for higher resistance zones.
Ali’s call last month perfectly captured the top. This time, his chart suggests SUI may be forming a base for recovery. While the coming days will reveal whether the buy signal plays out, the mix of indicator alignment and 5-hour strength paints a more positive picture.
Subscribe to our YouTube channel for daily crypto updates, market insights, and expert analysis.


