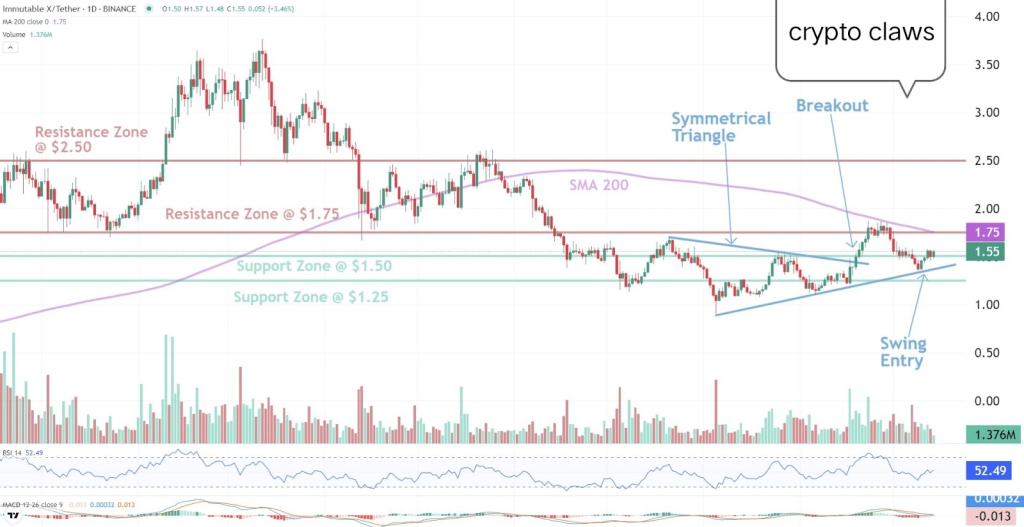
CryptoClaws, a prominent analyst, shared with his followers on X (formerly Twitter) how the IMX price recently experienced a breakout from a symmetrical triangle pattern, signaling potential bullish momentum.
As observed in the IMX chart, the price rallied toward a resistance zone before pulling back to key support levels. Traders are now watching this movement for future opportunities, particularly as IMX hovers around critical price points.
Doge2014 raises 500K in days celebrating Dogecoin. Make potentially big profits and get in on exclusive airdrop!
Show more +What you'll learn 👉
IMX Chart Analysis: Breakout from Symmetrical Triangle
A time of consolidation preceded the breakout above the top trendline, as indicated by the symmetric triangle formation on the IMX chart.
The IMX price rose into the resistance zone of $1.75 to $1.85 after this breakthrough, but it was met with resistance there. With the current bullish view suggesting the possibility of greater gains if critical levels are touched again, this pattern frequently indicates a change in market mood.
The 200-day Simple Moving Average (SMA), a popular indicator for determining long-term trends, is approaching, and this has drawn the attention of the IMX community to the breakout. The forthcoming price movement will be crucial for determining the token’s future path while the price of IMX is still below this barrier.

Support and Resistance Levels to Watch
Two primary resistance zones stand out: the first at $1.75, where the price encountered resistance after its recent breakout, and a higher resistance zone at $2.50. The $1.75 resistance aligns with the 200-day SMA, reinforcing its importance. Any potential rally beyond this level could pave the way for further upside.
On the downside, IMX’s price has pulled back to a support level of $1.50. This support is currently holding, making it a potential swing entry point. Traders might view this as an opportunity, especially with a stop loss suggested at $1.35 to mitigate risks.
According to CryptoClaws, the pullback to $1.50 presents a swing trade opportunity with a possible upside toward $1.80. The trade setup offers a favorable risk-to-reward ratio, with a clear entry at $1.50 and a stop loss placed below $1.35. The suggested target of $1.80 provides a potential upside, especially if the IMX price tests the $1.75 resistance zone once again.
This swing entry appeals to traders looking for short-term gains while managing risk effectively. The resistance zone and 200-day SMA act as key levels that traders will watch closely for potential breakout continuation.
Read Also: Shocking Phishing Attack Empties Crypto Wallet – PEPE Among Stolen Altcoins!
Indicators and Market Sentiment
The Relative Strength Index (RSI) shows neutral conditions at 52.49, suggesting that IMX is neither overbought nor oversold. This leaves room for further upward movement if buying pressure increases.
Meanwhile, the MACD indicator is slightly bullish, but relatively neutral overall. These indicators reflect a market that could shift in either direction, depending on upcoming price action.
IMX’s recent price movements, coupled with technical indicators, suggest a cautious but optimistic outlook for traders. The breakout has injected momentum into the token, but resistance levels and support zones remain key areas to watch.
Subscribe to our YouTube channel for daily crypto updates, market insights, and expert analysis.
We recommend eToro
Wide range of assets: cryptocurrencies alongside other investment products such as stocks and ETFs.
Copy trading: allows users to copy the trades of leading traders, for free.
User-friendly: eToro’s web-based platform and mobile app are user-friendly and easy to navigate.


