Silver has been one of the silent winners in the commodity space over the past year. While gold grabbed all the headlines, the silver price has been steadily climbing, up from below $20 to current levels near $74. That is a nearly 4x move in a few years.
But the past few weeks have been different. The silver price has stalled, trading sideways between $72 and $76, and the 4-hour chart is now showing a pattern that often leads to a big move. The question for anyone looking out to 2027 is simple. If you put $5,000 into silver today, where could that be by then?
What you'll learn 👉
Silver Is Taking a Breather Before the Next Leg
We had a look at the silver 4-hour chart, and the structure is textbook consolidation. The silver price is trading at $74.10, down 0.30% on the session, with a high of $74.50 and a low of $73.62.
The 100 period SMA sits below at $72.05, which has acted as solid support for weeks. Every time the silver price has dipped near that level, buyers have stepped in. The resistance above is at $76, then $78, then $80.
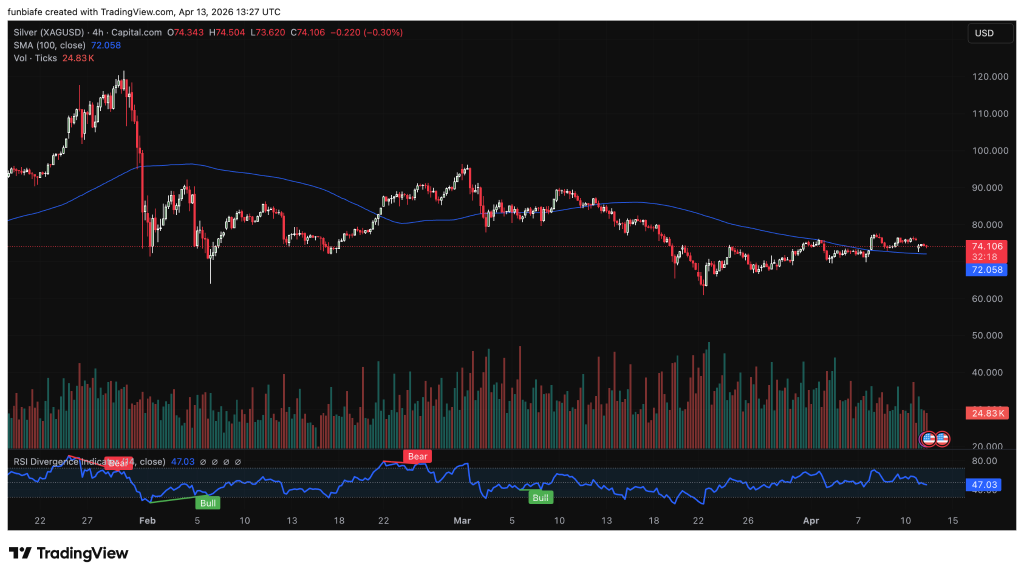
The RSI on the 4-hour chart is at 47.03, neutral and pointing neither up nor down. But the divergence indicator is worth watching. It shows a bearish setup on the last leg up, which means momentum is slowing.
That does not mean the silver price crashes. It means the recent rally is losing steam and a consolidation or pullback is normal. The volume is light at 24,830 ticks, which fits the sideways action. Low volume, tight range, no one getting excited.
Read Also: TAO News Today: Bittensor Co‑Founder (Finally) Responds to Covenant Drama
Why Silver Has Been Moving
The silver price does not move on hype or tweets. It moves on macroeconomics. Real interest rates, central bank policies, industrial demand, and the strength of the US dollar. Over the past few years, central banks have been buying gold and silver at record rates.
Industrial demand for silver is also rising because of solar panels, electric vehicles, and electronics. Silver is both a monetary metal and an industrial metal. That dual role gives it two sources of demand.
Tokenized silver is trading at $73.55, closely tracking the physical price. The market cap of tokenized silver is still small, but the infrastructure is being built. As more people want exposure to commodities without holding physical bars, tokenized silver could see real growth.
$5,000 Into Silver Today – What Happens by 2027?
The amount of $5,000 invested at a price of $74.10 per ounce will buy around 67.5 ounces of silver. After that, the performance will depend on the future direction of the silver price up until 2027.
If we consider the bearish scenario, then the price of silver will return to the range of $50-$55, resulting in the value of $5,000 declining to between $3,400-$3,700. The loss will be 25%-30%, which is significant but survivable.
For the neutral scenario, industrial demand for silver remains strong, driving its price up to $100-$120 by 2027. This translates into a positive return of 35%-60% from $5,000 to $6,700-$8,100.
Finally, in the bullish scenario, silver prices remain strong due to central banks buying and the weakening dollar. Silver prices can reach their historical levels of close to $150, translating into more than doubling the money from $5,000 to $10,100.
The silver price is consolidating right now. The 4-hour chart shows support at $72 and resistance at $76. A break either direction will set the tone for the next leg. For someone putting $5,000 into silver today, the risk reward looks better than most people think.
Subscribe to our YouTube channel for daily crypto updates, market insights, and expert analysis.