What you'll learn 👉
Total Market Cap Analysis
Let’s first look at what the overall market is doing. As you know, all coin prices are highly correlated with bitcoin’s price action and by extension with the whole market. Every time we see a surge or plunge of the total market cap, it spills over to the individual coins and their prices.
Market has lost almost $30 billion in three days dropped through a crucial Fib786 height at $241 billion after invalidating the uptrend line it formed and respected since end April. A drop to support at $219 billion is now likely even though it is holding firm around this area of $230 billion (all data is from Tradingview).
This should be the rebound zone back up to test the $241 billion mark from the other side.

As mentioned above, the overall market movements influence individual coins and Icon is no exception. A good thing for ICX holders is that Zilliqa kept its value in terms of satoshis
4H ICXBTC
ICX is currently in a non-trending environement, ranging in a horizontal channel between two heights of 4.4k and 5.1k sats.
There was one worrisome drop below a local bottom of 4.4k but ICX managed to stop the plunge at 4.2k and is right now sitting at 4.5k sats.
Breakout point for ICX would be the Fib236 level at 5470 sats. This is a breakout level for ICX and closing a candle above it would indicate a run towards the resistances from larger timeframes at 7k and local high at 7600 sats.
Breakdown level is at most recent lows around 4500 sats. A bad thing for ICX is that it broke the ascending uptrend line that if formed and respected for multiple bounces. A drop to 4.1k is becoming more likely especially if the market takes a more serious nosedive.

Daily ICXBTC
All moving averages are also aligned in a descending order, widely considered as the bearish setup. The price is bouncing off the EMA20 and failing to penetrate it, which is a good position to short ICX if you are trading on short timeframes.

Weekly ICXBTC
ICX is in a trendless randing on the weekly timeframe, indicating that a major trend is neither bullish nor bearish. It is bouncing up and down in this horizontal channel and only if it manages to break the 10k sats resistance, it would enter a major bull trend.Right now it is on the bottom line and the rebound from here is likely.

One thing to bear in mind is the turbulent and erratic nature of bitcoin – a sudden thrust up or slide down is always on the cards which would invalidate this and all other analysis and predictions. In such cases, market is shaken up with most traders exiting altcoins and entering bitcoin positions or seeking shelter in stablecoins, especially in the initial phases of bitcoin pumps and dumps. So it is always a good idea to keep a close eye on bitcoin’s behaviour before opening a long or a short on any other coin in the market.
Should this happen, stop by again to check out our updated charts and thoughts.
Trading volume is relatively low – reported volume in the last 24hrs is $6.8m (the strongest volume day in April for ICX was April 23rd with $40.4m) and “Real 10” (trading volume on the exchanges that provably prevent wash trading) volume is 3x lower – $2.2m. This means that ICX’s liquidity is only moderately inflated and its trading volume is overstated by 3x which is comparatively great ratio.
In the last 24 hours, 49% of trading has been on Binance, followed by DragonEX, LocalTrade and HitBTC. Most traded ICX pair has been ICXUSDT – 49%, followed by ICXBTC at 37%.
Moreover, ICX has a somewhat strong buy support, according to coinmarketbook.cc. Buy support is measuring sum of buy orders at 10% distance from the highest bid price. This way we can eliminate fake buy walls and whale manipulation and see the real interest of the market in a certain coin. ICX currently has a $685k of buy orders measured with this method, which sets ICX buy support/market cap ratio at 0.43%, a wide-market average. Bitcoin and Ethereum have a 0.27% and 0.28% ratios, respectively. This novel metric indicates there are a lot of manipulations, inflated liquidity and fake orders on all crypto trading pairs, including ICX pairs.
Social metrics
Icon’s market sentiment score, measured by the market analytics firm Predicoin, paints a neutral picture.
Predicoin wraps its analysis up into a single simple indicator known as the SentScore, which is formed from the combination of five different verticals: news, social media, buzz, technical analysis and fundamentals.
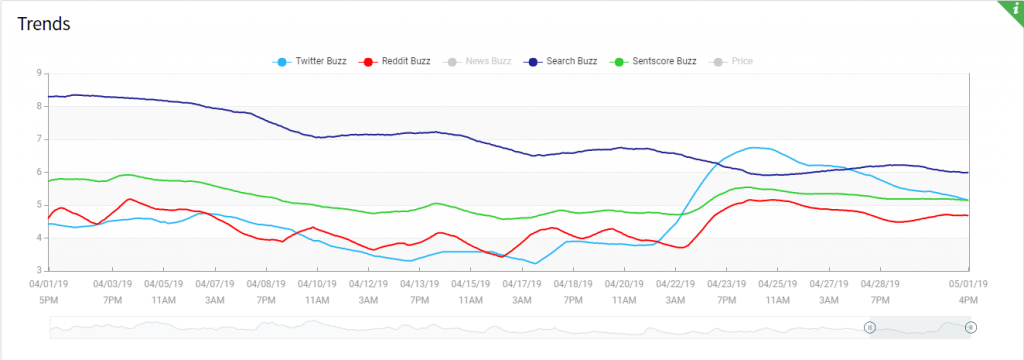
Icon currently has a Sentscore of 4.3 which is defined as “the neutral zone”. You can see that Reddit buzz has stayed pretty much the samein the last 30 days with a dip in activity in the middle of month. Twitter buzz has picked up while the search volume on search engines has marginally decreased. The overall sentscore has been on the same level for the last 30 days, fluctuating in the zone between 4.5 and 6.0.
Overall, Predicoin’s Sentscore is an excellent indicator of community interest and can provide useful insight into which coins are trending right now.
Mid May Update: Fundamentals
To assess fundamental health of a project, we used the FCAS metric. FCAS is a comparative metric whose score is derived from the interactivity between primary project lifecycle fundamentals: User Activity, Developer Behavior, and Market Maturity.
There are a few sub components which provide data to each fundamental:
User Activity is comprised of Project Utilization and Network Activity
Developer Behavior is comprised of Code Changes, Code Improvement and Community Involvement
Market Maturity is comprised of Liquidity and Market Risk. Market Maturity has less than 5% impact on a project’s overall FCAS.
FCAS ratings are on a 0-1000 point scale with a corresponding letter grade. Break points are based on standard deviations in the underlying component distributions.
900 – 1000 is marked as S for superb. 750 – 899 is marked as A for attractive. 650 – 749 is marked as B for basic. 500 – 649 is marked as C for caution. And finally, below 500 is marked as fragile. You can read more about it here.
Icon has been ranked as the C category – cautious with overall 590 points as of May 7th. By far the strongest metric that contributed to this bad score is developer activity that got 833 points, while terrible user activity amounted to only 268 points and market maturity had 629 points. This valuation model doesn’t look favorably on ICX as it puts a lot of emphasis on its low utility and network activity.
Below are some of the most important news around the project in the last 30 days.
- P-Rep TestNet have opened on April 30th. The TestNet will allow P-Rep candidates to check the technical status of the nodes and simulate activities to ensure long-term stable operation of ICON Network in the future. Once theP-Rep TestNet Application Form (http://bit.ly/2UOW7Dz) is submitted, the ICON Team will review the application and provide TestNet access to successful candidates. The P-Rep TestNet will run depending on operational and technical circumstances. P-Rep stands for public representative. The ICONstitution and Governance Paper states that P-Reps “propose and vote on policies that maximize overall ICONists interest of the ICON network.”
- In other newsworthy events, Icon entered a partnership with SBI Savingsbank to release blockchain-based personal authentication services. They also started cooperation with UN Agency for information and communication technology and also with VELIC, a listing partner for ICX Station. You can read their official summary of Q1 on this medium post.


