
Bitcoin is slipping toward the $90,000 zone, and the entire crypto market is following with heavy red. But this is way more than just a regular correction, it’s a collision of leverage unwinding, institutional outflows, and technical breakdowns happening all at once. The result is a market-wide flush that has erased billions in hours.
Here’s what’s really going on.
What you'll learn 👉
Derivatives Meltdown Triggered the First Wave of Selling
The first domino fell in the derivatives market. Total open interest plunged 9.75%, dropping from $759B to $685B, as traders rushed to close their leveraged positions. Bitcoin alone saw $130M in liquidations. Even more telling, shorts surged 226% the moment BTC broke below the $95K support.
Perpetual funding rates spiked 216%, punishing long positions and draining momentum from bulls. With the spot-to-perps volume ratio sitting at 0.22, derivatives completely dictated the selloff. The more open interest collapsed, the harder price fell — a classic self-reinforcing flush.
The key level to watch now is the 200-day EMA near $97K. If Bitcoin doesn’t reclaim it soon, analytics firms estimate more than $3B in futures liquidations could be triggered below.
Institutions Hit the Exit Button as Risk-Off Sentiment Builds
TradFi didn’t step in to stabilize the drop, it accelerated it.
Bitcoin ETFs saw holdings fall 3.5% in just 24 hours, according to CoinMarketCap. BlackRock’s IBIT alone shed $2.1B. Ethereum ETFs were hit even harder, with AUM dropping 6.2% to $18.97B.
This wasn’t isolated profit-taking. It was broad de-risking.
The crypto–Nasdaq correlation jumped to 0.86, meaning every downside move in stocks bled directly into crypto. When institutions dump risk assets, ETFs become forced sellers, and that pressure flows straight into spot markets.
Technical Structure Broke Down, Pulling Algorithms Into the Selloff
The final hit came from technical levels snapping.
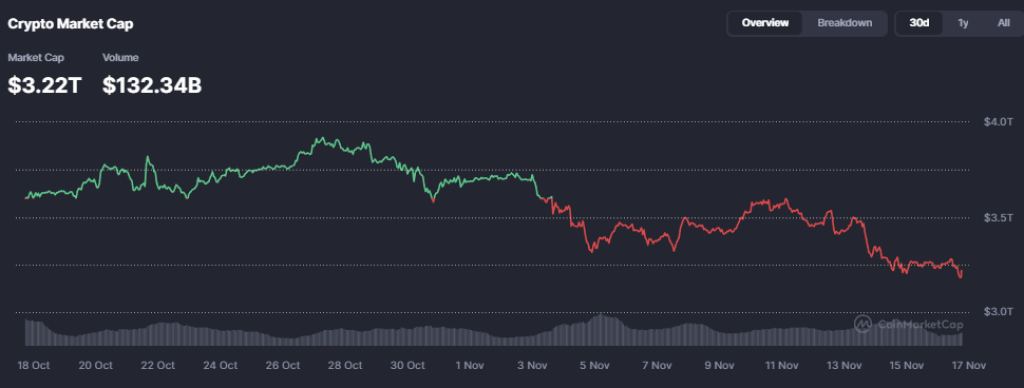
Total market capitalization fell below the 200-day SMA at $3.63T, one of the most widely watched bull-market indicators. RSI-14 dropped to 28.5; oversold, but not at a point where buyers automatically step in.
Meanwhile, the MACD histogram fell to –$24.67B, confirming accelerating bearish momentum.
Once these signals flipped, algorithmic trading systems joined the selling, pushing the market even lower. The next major support sits at the 78.6% Fibonacci retracement around $3.33T, and that is where many quant models will look for stabilization.
Read also: XRP Dumps on ETF Launch: Here’s the Real Reason the Price Didn’t Moon
A Perfect Storm, But Not the End
In short, the selloff is not about one single narrative. It’s the combination of:
• leverage unwinding,
• institutional outflows,
• and a full technical breakdown.
Fear & Greed has dropped into panic territory, signaling an oversold market that might be closer to a bounce than a deeper crash, but the rebound needs a catalyst. The biggest near-term signal will be whether ETF flows stabilize after the London session opens. If inflows return, institutions may start bargain hunting.
Until then, expect volatility, fakeouts, and rapid swings as the market searches for support.
Subscribe to our YouTube channel for daily crypto updates, market insights, and expert analysis.