Optimism has started turning heads again as it moves sideways inside a familiar chart setup. The project, which is helping scale Ethereum through its Superchain framework, is now sitting at a technical zone that’s getting a lot of attention from traders. Right now, OP price is hovering near a key support level within a rising wedge, and if it can push past nearby resistance, things could get interesting fast.
Top analyst AltCryptoTalk broke down the setup on X. According to them, OP has been in a medium-term uptrend and is trading inside a flat, rising broadening wedge. The token is now near the lower edge of that wedge, a spot where buyers usually start to get active. The tweet also pointed out that a breakout above $0.71 could be the spark that kicks off the next move higher.
What you'll learn 👉
Technical Structure of the Optimism Chart
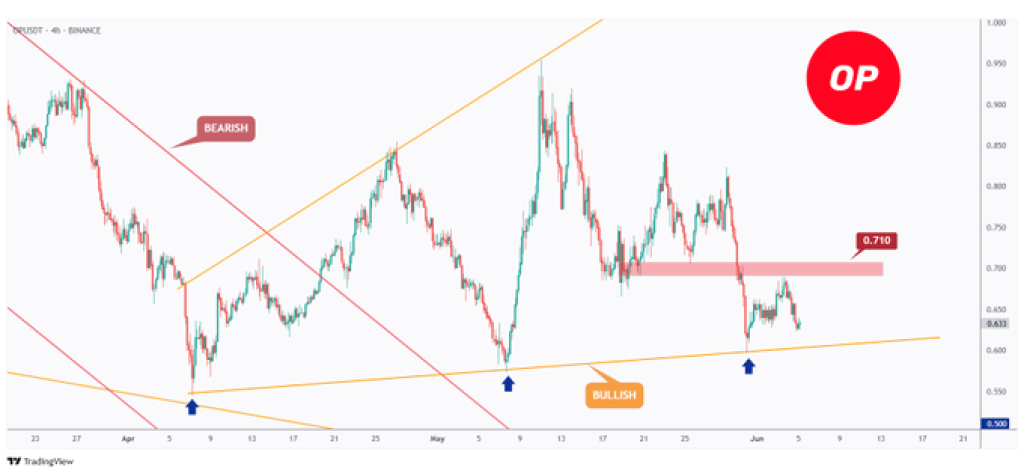
The 4H chart of OP shows a shift in structure since April. The price initially broke above a descending trendline that had been in place since March. Following that breakout, OP price has traded within a broadening wedge pattern outlined in orange. This pattern features ascending support and resistance levels.
The lower wedge trendline has held as support on multiple occasions. Three separate reactions at this level suggest steady interest from buyers. The upper boundary has acted as resistance, limiting upward movement. The formation of higher lows at the wedge base supports the possibility of continued bullish behavior if the support holds.
Optimism Key Support and Resistance Levels
OP has shown consistent support between the $0.60 and $0.62 range. This price area has triggered rebounds on three occasions, reinforcing it as a key zone. The resistance level marked at $0.71 represents the next major price ceiling. The price has been rejected from this zone before, and it now stands as the level that may need to break to start the next impulse move.
If OP price manages to push above $0.71, it will target between $0.85 and $1.00 become possible based on prior market structure. This aligns with the round-number psychological level mentioned in the tweet. On the downside, if support fails, traders may look to the $0.53–$0.55 area for the next reaction.
Read Also: $36 Million in SHIB Tokens Just Moved to Coinbase: What’s Really Happening?
Optimism Price Behavior and Market Context
Market structure suggests ongoing consolidation within the wedge. Despite a lack of higher highs, higher lows have formed consistently. This reflects a potential accumulation phase at the lower wedge support. The tweet from AltCryptoTalk aligned with this interpretation, indicating that traders are watching for a bullish trigger.
The optimism surrounding OP price is also influenced by its role in Ethereum’s scaling ecosystem. The Superchain initiative positions Optimism as a contributor to wider Layer-2 adoption. These fundamentals continue to support market attention, though price confirmation through breakout remains pending.
Subscribe to our YouTube channel for daily crypto updates, market insights, and expert analysis.

We recommend eToro
Wide range of assets: cryptocurrencies alongside other investment products such as stocks and ETFs.
Copy trading: allows users to copy the trades of leading traders, for free.
User-friendly: eToro’s web-based platform and mobile app are user-friendly and easy to navigate.