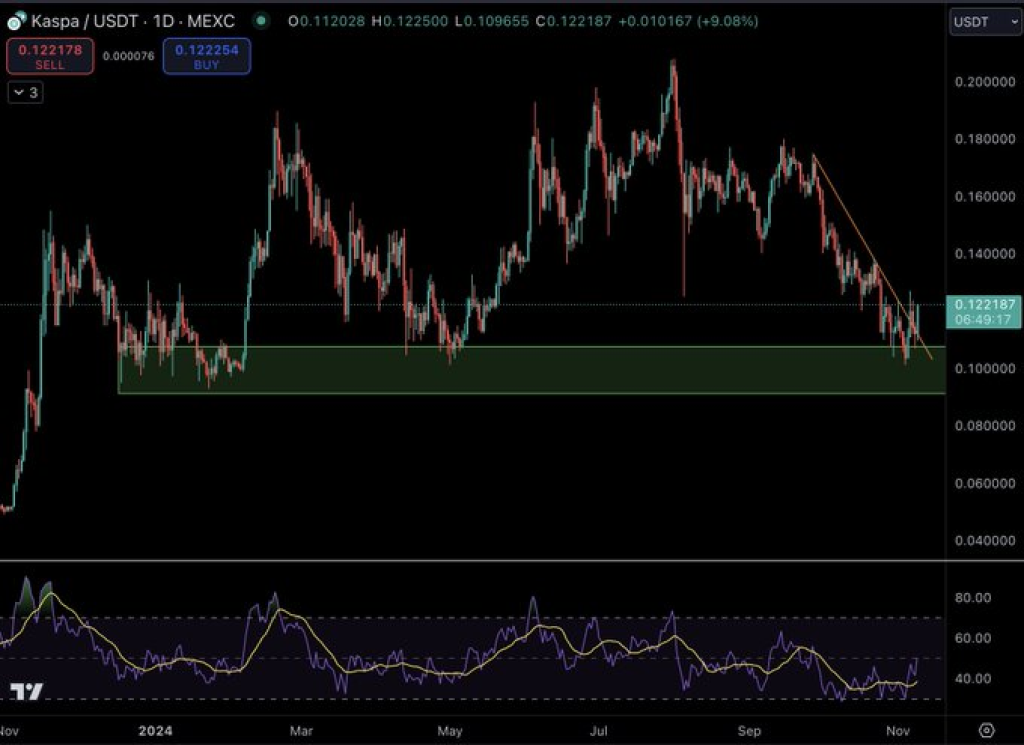
Kaspa (KAS) could be on the brink of a massive rally as it gains momentum off a key support level. Popular analyst Jeff Sekinger recently shared on X (recently Twitter) about Kaspa’s price movements, hinting at the potential for a triple-digit month similar to what KAS experienced last November. This recent price bounce, along with historical patterns, is fueling optimism among traders who anticipate a bullish run.
What you'll learn 👉
Kaspa Chart Analysis: Strong Support Zone Fuels Optimism
The KAS chart reveals a clear support zone between $0.10 and $0.11, where Kaspa’s price has consistently bounced over recent months. This range has been pivotal in providing a strong foundation for the token, allowing buyers to step in and prevent further declines.
After touching this zone, KAS experienced a 9.08% daily increase, reaching around $0.122. The consistent bounce from this zone suggests a bullish sentiment among investors, as they continue to accumulate at these levels.
Resistance levels above, particularly around $0.18 to $0.20, present potential targets if the price breaks out of the current consolidation. These resistance points will be crucial in determining the strength and sustainability of any upward movement in KAS price.

In addition to the strong support zone, Kaspa’s price recently broke through a downward trendline, indicating a shift in market sentiment. The trendline, which had previously been connecting lower highs, reflected a bearish trend that seems to be weakening.
This breakout from the trendline signals the possibility of a reversal, with bulls potentially taking control of the market. If KAS can maintain this upward momentum, it may pave the way for a substantial rally, aligning with Sekinger’s tweet about a potential triple-digit month.
Read Also: Why is Notcoin (NOT) Price Up Today?
RSI Indicates Momentum Shift
The Relative Strength Index (RSI) adds further weight to the bullish outlook. Currently positioned slightly above the midline, the RSI suggests a positive momentum shift without reaching overbought levels.
Historically, KAS has seen local bottoms when RSI dipped into the 40–45 range, which aligns with the current reading. This indicator suggests that KAS could be preparing for further gains if buying interest continues.
Seasonal Pattern in Kaspa’s Price
Jeff Sekinger’s tweet draws attention to a possible seasonal or cyclical pattern in Kaspa’s price movements, with last November delivering notable triple-digit gains. This historical trend may influence traders’ expectations, with some viewing November as a favorable period for KAS. Sekinger’s observation that “the bounce has just started” underscores this sentiment, hinting at the possibility of a sustained upward trajectory.
Subscribe to our YouTube channel for daily crypto updates, market insights, and expert analysis.
We recommend eToro
Wide range of assets: cryptocurrencies alongside other investment products such as stocks and ETFs.
Copy trading: allows users to copy the trades of leading traders, for free.
User-friendly: eToro’s web-based platform and mobile app are user-friendly and easy to navigate.


