In the past two days, dogwifhat (WIF) meme coin has jumped over 30%, going from about $0.68 to $0.87. So what’s behind this sudden pump, and is WIF finally turning bullish?
Let’s take a closer look at the chart to understand what’s going on.
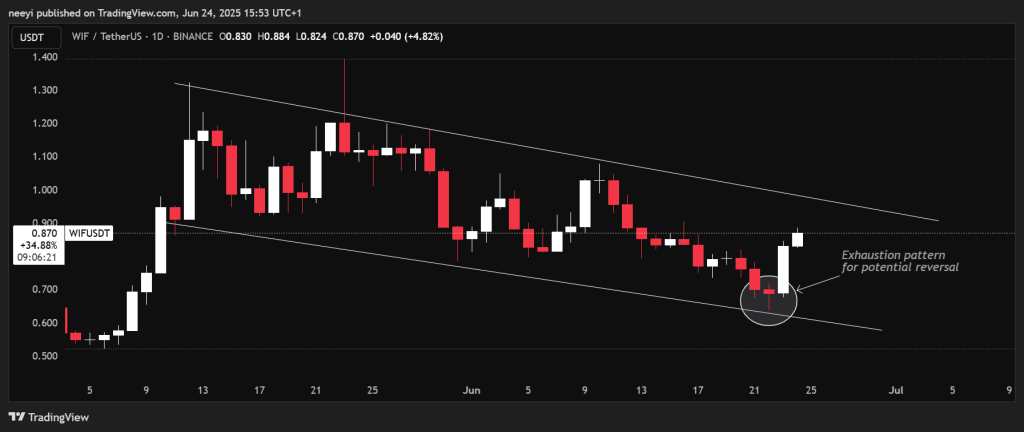
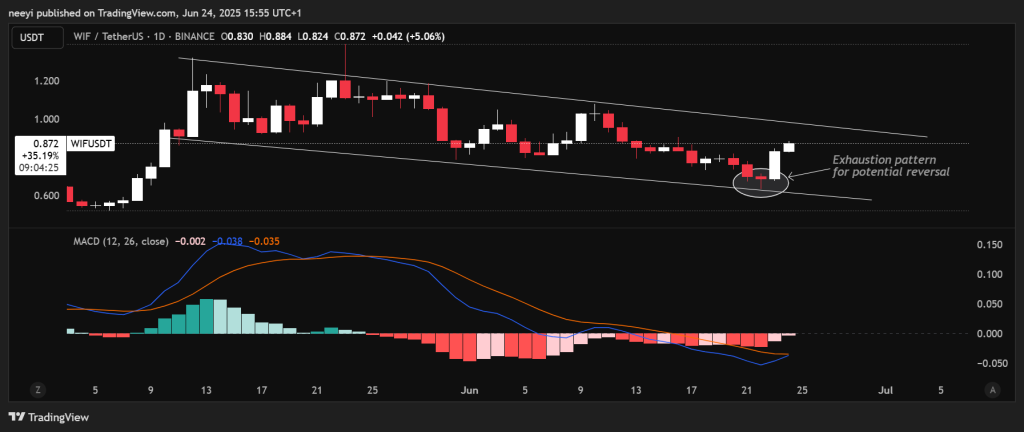
The rally started after WIF dropped to around $0.62. If you look at the chart, there was a long wick on the candle from two days ago. That usually means the price dipped but got quickly bought up, which can be a sign that buyers are stepping in.
That bounce didn’t happen randomly. It came right at the bottom of a falling channel that WIF has been moving in for weeks. When prices hit the bottom of a pattern like this and bounce strongly, it often gets traders excited and ready to buy.
At the same time, Bitcoin also bounced after briefly dipping below $100k over the weekend. The market had panicked over some geopolitical news, but that fear didn’t last. Once Bitcoin recovered, many altcoins followed along and WIF was one of them.
Is WIF Really Bullish Now?
Even though WIF pumped, it’s still trading inside that same downward-sloping channel. Right now, it’s just moving back toward the top of the channel. That upper line could act like a wall and push the price back down.
So this could just be a short-term bounce, not a full trend reversal. If WIF breaks above the top of the channel and holds that level, then things could get a lot more bullish. But until that happens, the bigger trend is still down.
What the Bollinger Bands and MACD Are Saying
Bollinger Bands show where the price might be too low or too high. Two days ago, WIF hit the lower band and bounced hard. That often means the coin was oversold and due for a move up.
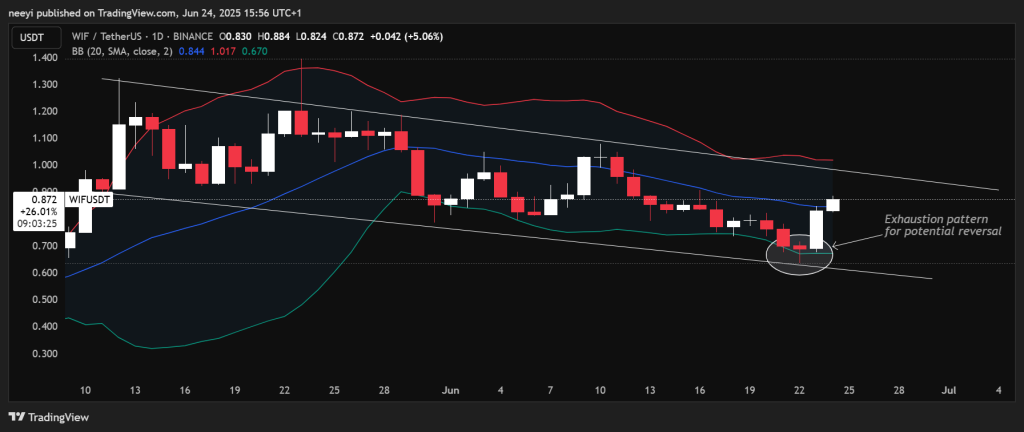
Right now, it’s heading toward the middle of the bands, which is basically the average price line. If WIF can break above that, the next target would be the upper band, and that lines up with the top of the channel we’ve been talking about.
The MACD is another tool that helps track momentum. Right now, it’s showing signs that the downtrend is slowing down. The lines are starting to turn upward, and the red bars are shrinking.
But it’s not quite bullish yet. For a proper signal, the blue MACD line needs to cross above the orange one. If that happens, it would be a stronger sign that WIF might be ready for a real breakout.
WIF is definitely heating up, but this move looks more like a bounce than a breakout for now. It’s still inside the same channel it’s been in for weeks, and it hasn’t pushed past the resistance at the top.
The bounce looks strong, and momentum is building, but the trend hasn’t flipped just yet. Keep an eye on that upper line of the channel. If WIF breaks through, things could get a lot more exciting. If not, this might just be another temporary pump.
Subscribe to our YouTube channel for daily crypto updates, market insights, and expert analysis.