Top analyst Satoshi Flipper revealed to his followers about Celestia’s recent price movement and noted that TIA’s price was “nicely on the move,” demonstrating resilience amid BTC’s erratic behavior.
Traders are taking notice of Celestia (TIA) due to its persistent upward trend. TIA has maintained its rising trajectory despite market volatility, particularly about Bitcoin (BTC) swings. Moreover, TIA is among the top 10 gainers in the market today, adding to the growing interest around the token.
Doge2014 raises 500K in days celebrating Dogecoin. Make potentially big profits and get in on exclusive airdrop!
Show more +What you'll learn 👉
Celestia (TIA) Chart Analysis: Upward Momentum Within a Descending Channel
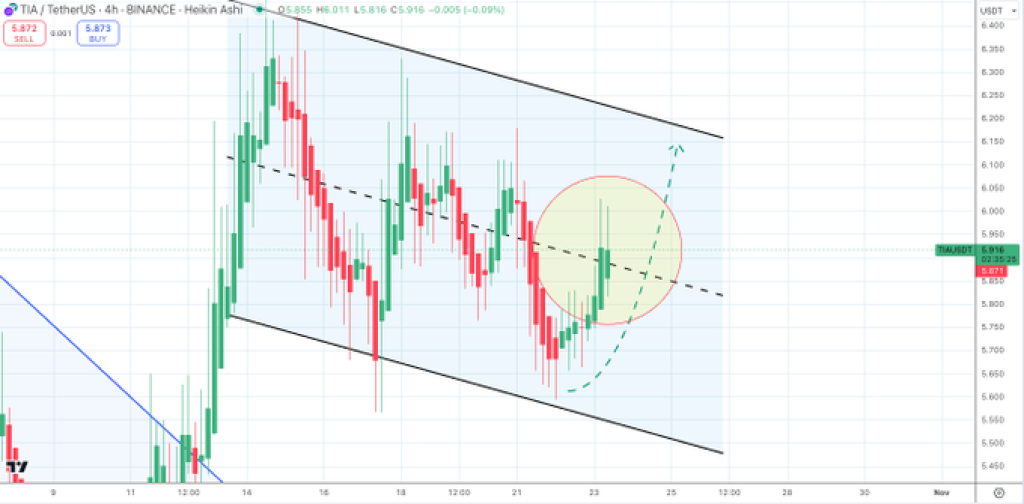
The 4-hour chart reveals that TIA’s price has been trading within a descending channel, bounded by two parallel trendlines. Despite the overall downward trend, the price has managed to find support at the lower boundary, creating opportunities for upward movement.
Recently, TIA’s price bounced off this support level, climbing past the median trendline, which often acts as a pivot point. This movement suggests a potential shift in sentiment, hinting at a short-term bullish outlook.

Furthermore, the chart indicates that the red circular zone represents where TIA’s price gained significant momentum, marking a potential breakout point. For this bullish trend to continue, TIA would need to challenge the upper resistance line of the channel. A successful breach above this level could open the door for further gains.
Independent Movement Despite Bitcoin Volatility
Satoshi Flipper’s tweet underscores TIA’s unique movement amid a volatile market, particularly mentioning “zero [concern] given about today’s wild BTC volatility.” This indicates that TIA has been relatively unaffected by Bitcoin’s fluctuations, maintaining its upward trajectory.
The analyst further emphasized confidence with the statement “LFG 🚀🚀,” signaling strong bullish sentiment within the community.
This independent movement suggests that TIA’s price might not be entirely swayed by broader market trends, which could be favorable for traders looking for opportunities beyond major cryptocurrencies like BTC. If this trend continues, TIA could see a shift in investor interest, potentially driving higher trading volumes.
Read Also: Dogecoin (DOGE) Price Could Resume Surge to New All-Time High as Familiar Bullish Pattern Reemerges
Key Support and Resistance Levels to Watch
The lower trendline of the channel has consistently acted as a support level for TIA. Whenever the price approaches this area, it tends to bounce back, which has been a pattern seen multiple times. This support level appears to be a strong indicator of bullish sentiment, helping maintain stability even when broader market conditions are unpredictable.
On the other hand, the upper trendline represents the resistance TIA’s price needs to overcome to confirm a bullish breakout. Breaking past this resistance could signal further gains, while a rejection might lead to a retest of the support zones.
Subscribe to our YouTube channel for daily crypto updates, market insights, and expert analysis.
We recommend eToro
Wide range of assets: cryptocurrencies alongside other investment products such as stocks and ETFs.
Copy trading: allows users to copy the trades of leading traders, for free.
User-friendly: eToro’s web-based platform and mobile app are user-friendly and easy to navigate.


