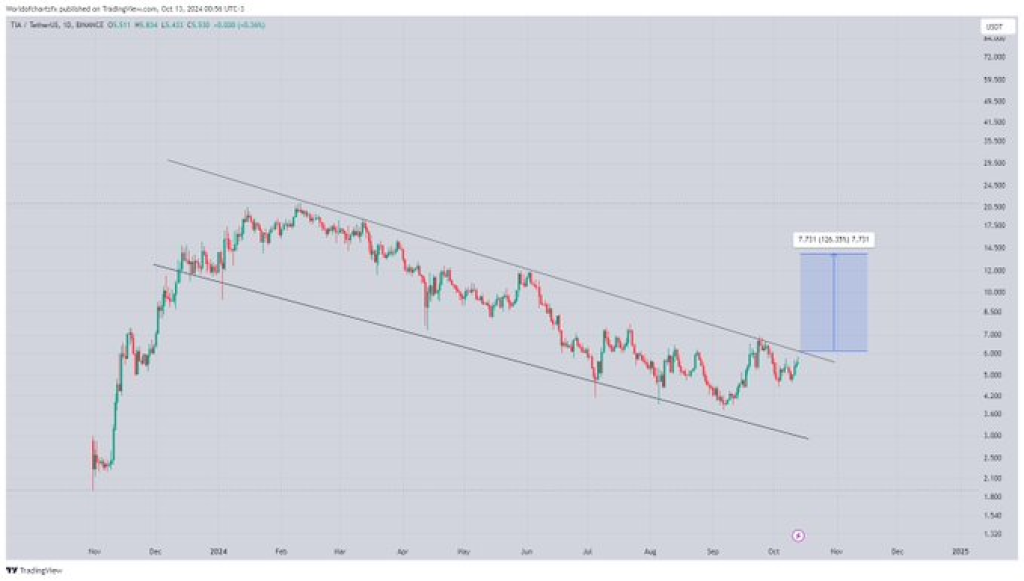
World of Charts, a top analyst on X, recently shared details about Celestia’s (TIA) latest price action. The analyst hinted at a potential breakout for TIA’s price, forecasting major gains.
With the asset already performing well, this analysis points toward a possible continuation of its upward trajectory, potentially doubling in value.
What you'll learn 👉
Celestia’s Price Action Within a Descending Channel
The TIA’s price action has been largely contained within a descending channel for some time. The TIA chart, based on a daily timeframe, highlights how the token has faced resistance at the upper boundary of this channel while finding support at the lower trendline. Each time the price tested the lower boundary, it bounced back, signaling consistent buyer interest.
Currently, TIA is nearing the upper boundary of this channel, indicating a potential breakout if this resistance level is breached. A successful breakout above this descending trendline could signal the end of a prolonged correction, opening the door for a significant upward move.
Doge2014 raises 500K in days celebrating Dogecoin. Make potentially big profits and get in on exclusive airdrop!
Show more +Breakout Potential and Expected Price Targets
The technical analysis suggests that TIA’s price could be on the verge of breaking out from this bearish channel. The TIA chart highlights a possible price target in the $12 to $15 range, which is nearly double the current price levels. This aligns with the prediction in the tweet from World of Charts, which mentions a potential for a 2x gain after the breakout.
World of Charts pointed out that TIA has already generated good profits for traders and is now poised for another major rally. This sentiment has been backed by chart patterns, with the price showing strong momentum as it attempts to push through the channel’s upper boundary.

Read Also: Why Is Kaspa (KAS) Not Running Anymore? KAS Price Prediction
Analysts Signal Potential for Further Gains
As per the analysis, the descending channel’s upper boundary is a critical level to watch. Should TIA manage to break through this resistance, it could mark the beginning of a new bullish phase for the token. This could attract additional buyers and create further upward pressure on the price.
The box highlighted on the chart shows a potential price range for TIA post-breakout, offering traders insight into the possible upside of the token. The expectation of a major breakout is shared by many in the crypto community, adding to the anticipation surrounding Celestia’s next move.
Investors are keenly watching TIA’s price action, waiting to see if the asset will break out of the descending channel. The potential for a major rally has been clearly outlined by analysts and technical charts, with World of Charts expecting significant gains should the breakout occur. Traders are advised to monitor TIA closely as it approaches this key resistance zone, with bullish sentiment building.
Subscribe to our YouTube channel for daily crypto updates, market insights, and expert analysis.
We recommend eToro
Wide range of assets: cryptocurrencies alongside other investment products such as stocks and ETFs.
Copy trading: allows users to copy the trades of leading traders, for free.
User-friendly: eToro’s web-based platform and mobile app are user-friendly and easy to navigate.


