
On the Hedera chart, we can see that the HBAR price has spent the last few weeks in a clear downtrend. Around mid-November HBAR was trading near the $0.18 area before selling pressure accelerated and pushed it down to a local low around $0.122 in the third week of November. From there, buyers finally stepped in, triggering a sharp relief rally into the $0.15–$0.152 zone, but that bounce stalled and turned into a sideways range between roughly $0.145 and $0.155.
Over the past week, that range broke lower again. HBAR rolled over from the mid-$0.14s and slid back toward the mid-$0.13s, where it’s trading now around $0.135. The overall structure is still lower highs and lower lows, but the speed of the drop has slowed compared to the first half of the chart.
What you'll learn 👉
HBAR Chart: Key support and resistance zones
The obvious support area on this timeframe is the prior swing low around $0.122–$0.124. That’s the level that arrested the November sell-off and launched the last bounce, so if price revisits it, traders will be watching to see if it holds again. Above current price, the first resistance sits around $0.145, where several 2H candles previously topped out. The next band comes in near $0.155–$0.16, which capped the post-bounce rally and lines up with earlier consolidation.
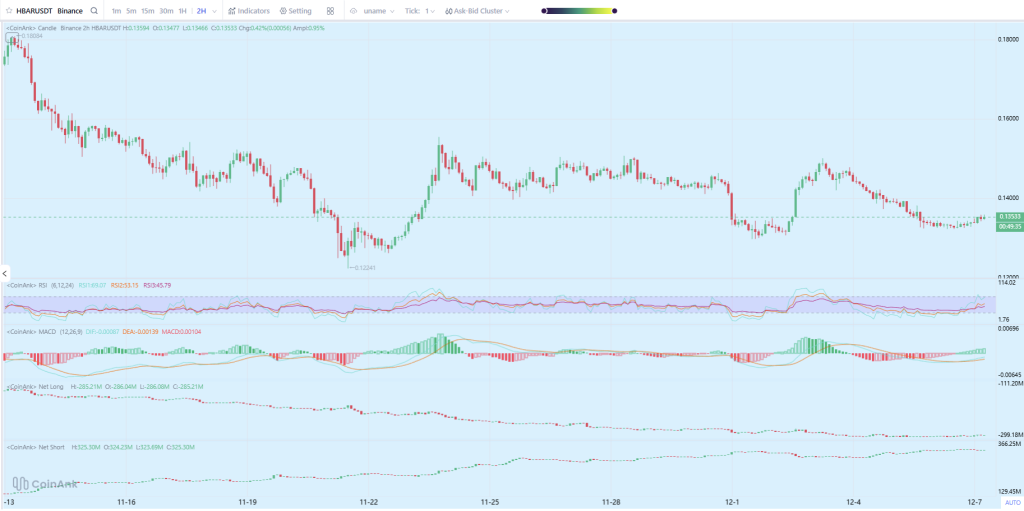
Short term, $0.13 is also acting as an intraday support pivot: dips into that area have started attracting some buying, but it hasn’t been properly tested under heavy sell volume yet.
RSI and MACD: momentum is stabilizing, not roaring bullish
On the RSI panel, HBAR dipped into oversold territory near the November low, then bounced back and is now sitting slightly above the midline. The fast RSI line is hovering in the 50–60 region, which tells you selling momentum has cooled, but there’s no strong overbought signal either. It’s a neutral-to-slightly-constructive read: bears have lost some control, but bulls haven’t taken over.
MACD tells a similar story. Both MACD and signal lines are still just below the zero line, reflecting the broader downtrend, but they’ve converged and the histogram has recently flipped from red to slightly green. That’s usually an early sign that downside momentum is fading and a short-term bullish crossover is either happening or close.
Net longs vs net shorts: positioning still leans bearish
The net positioning data at the bottom is interesting. Net longs sit around 285M HBAR, while net shorts are closer to 325M. Shorts outweigh longs by roughly 40M tokens, which is a meaningful tilt toward the bearish side. Over the past month, you can see net longs grinding lower and net shorts drifting slightly higher, suggesting more traders are hedging downside or actively betting against HBAR rather than positioning for a big squeeze.
That combination – fading momentum but still short-heavy positioning – can cut both ways. If price breaks down, shorts are already in control. But if a catalyst forces a bounce, there’s fuel for a short-covering move.
Read also: Here’s Where XRP Price Could Go This Week
Fundamental tailwinds: real-world adoption is building
On the fundamental side, Hedera just signed a memorandum of understanding with Georgia’s Ministry of Justice to explore moving the national land registry onto Hedera and tokenizing real estate.
This follows Dubai’s 2025 initiative to put land titles and real-estate tokenization on a blockchain registry, where Hedera has been positioned as a key infrastructure partner ; an announcement that previously coincided with a 22% HBAR rally as traders priced in real-world asset (RWA) adoption.
Taken together, Georgia plus Dubai reinforce the same narrative: governments are actually testing Hedera for high-stakes public registries, not just pilots with startups.
HBAR price outlook for the next 7 days
Putting it all together:
- Base case (most likely): With RSI mid-range, MACD stabilizing and shorts still heavier than longs, the HBAR price looks set for a consolidation week rather than a trend reset. A reasonable range for the next 7 days is $0.13–$0.15, with price chopping sideways as the market digests the Georgia news and broader altcoin sentiment.
- Bullish scenario: If buyers lean into the land-registry headlines and Bitcoin stays relatively stable, HBAR could squeeze back into the $0.145 resistance and make a run toward $0.155–$0.16. That would require a clean reclaim of $0.145 on strong 2H candles and some unwinding of short positioning.
- Bearish scenario: If altcoins see another leg down or the short side presses its advantage, a break below $0.13 opens the door to a retest of the $0.122–$0.124 support. Losing that level convincingly would put the trend back into full risk-off mode and invalidate the early momentum improvements we’re seeing on MACD and RSI.
As always, this is just technical and news-driven analysis, not a guarantee. HBAR’s path this week will still depend heavily on overall market risk appetite – but from this chart, the battle lines are pretty clear: $0.13 and $0.122 below, $0.145 and $0.16 above.
Read also: Time to Buy Hedera at Current Levels? Analyst Updates His HBAR Price Outlook
Subscribe to our YouTube channel for daily crypto updates, market insights, and expert analysis.