Kaspa (KAS) enters the week with momentum that started after the Kasplex upgrade added full smart contract support on December 4. The upgrade sparked a strong 19% rebound and shifted attention back to the KAS price after a tough month.
Coinbase Derivatives later opened KAS perpetual futures, giving traders round-the-clock access and adding fresh liquidity.
Kaspa ecosystem also expanded across other chains, creating more places where KAS can move and be used. With these developments carrying into this week, the chart now sits at an important point.
What you'll learn 👉
What the KAS Chart Is Showing
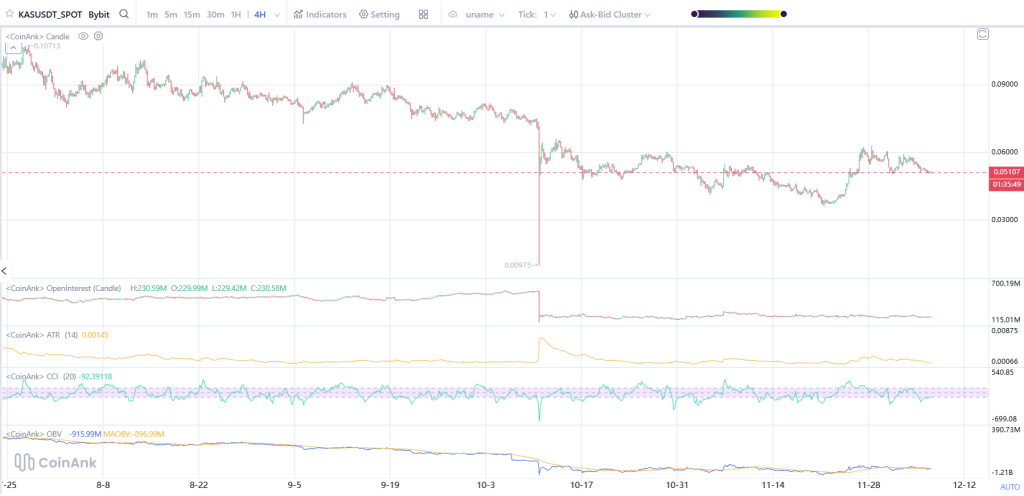
The Kaspa price has been moving down since early August, falling from the highs near $0.107 and sliding lower step by step. Each attempt to break the trend has failed, and the small consolidation periods on the chart never turned into real reversals.
The strongest move on the chart is the sharp drop in early October, when KAS briefly flushed toward $0.0097 before recovering. That liquidation spike created a temporary bottom, but the recovery stalled around $0.06 before fading again.
At writing, the KAS price sits around $0.051, with price moving sideways after a small bounce. The structure shows lower highs forming consistently, which means buyers have not yet shown real strength.
Even recent rally attempts failed to reclaim the breakdown levels from mid-November. The broader pattern still resembles a controlled drift lower, with no clean breakout structure forming yet.
Market Indicators
Open interest has dropped sharply since the October flush and has remained flat ever since, showing that traders are not adding new leveraged positions. This usually means that strong trend moves are unlikely until fresh open interest enters the market.
ATR is also low, confirming that volatility has compressed. Low volatility often sets up larger moves, but direction remains unclear.
CCI touched oversold levels before bouncing, which explains the short-term recovery, but the indicator remains below neutral – a sign that the trend still leans bearish.
OBV has been falling steadily since August, showing sustained distribution. Even with rebounds, volume has not supported a full reversal. Funding rates are near neutral, meaning futures traders have no strong directional bias.
Read Also: Here’s Where XRP Price Could Go This Week
Kaspa Price Short-Term Outlook for This Week
If KAS loses the $0.049–$0.050 zone, the chart opens the door for another retest of the October lows near $0.0097, though such a deep move would likely require a broader market breakdown. For now, the more realistic downside target is around $0.045, where previous liquidity built up.
On the upside, the KAS price needs to reclaim $0.060 to show that buyers are gaining control. That level has rejected price multiple times and acts as the key line separating this consolidation from a real reversal. If KAS closes above it, momentum could carry toward $0.067 this week.
Kaspa fundamentals look much stronger than its current chart. Smart contract support, futures access, and new integrations all help long-term growth.
But until volume and open interest increase, the short-term picture remains cautious. This week will likely come down to whether the KAS price can hold the $0.050 support zone long enough for buyers to step back in.
Subscribe to our YouTube channel for daily crypto updates, market insights, and expert analysis.