

The Kaspa (KAS) price is starting the week pegged just below the $0.05 level, an area of the price chart that traders have been watching rather closely as it follows a strong price increase.
Breaking away from the range of $0.044-$0.045, KAS saw an increase, touching the $0.050 region briefly before slowing down somewhat, indicating that there is no sudden change but rather a mere halt or slowdown at this point.
Despite the pullback, price hasn’t given up much ground, which says a lot about current market confidence. Momentum has been supported by Kaspa (KAS) recent spot and margin trading debut on HTX (formerly Huobi), which introduced up to 10x leverage and significantly expanded access for traders.
Moreover, trading activity around Kaspa has clearly picked up, with volume more than doubling to about $33 million. That kind of jump usually means more eyes on the market and a rise in short-term speculation.
With the KAS price now sitting around the $0.048 area, the market is at a turning point , either buyers step in to defend this zone and push prices higher, or the rally takes a breather after its recent burst..
What you'll learn 👉
What the Kaspa Chart Is Showing
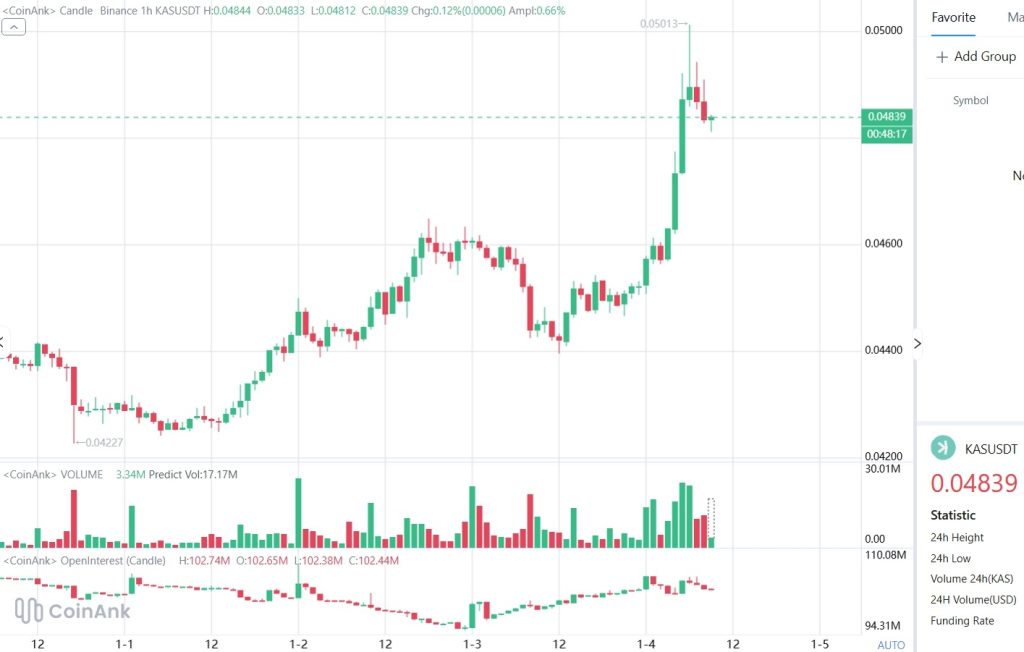
The KAS chart remains constructive. In the 1H chart, price has clearly exited a multi-day consolidation and has started forming a pattern of higher highs and higher lows.
As long as the Kaspa price remains higher than this area, the short-term outlook will remain positive. A drop below it could see price ease back toward $0.046, an area where buyers are likely to show up again. The fast move toward $0.050 and the pullback that followed didn’t spark heavy selling.
Instead, price has tightened into a narrow range, which usually points to consolidation, not fading strength. The rejection near $0.050 looks more like a pause than a reversal.
That behavior suggests consolidation after a breakout, not exhaustion. For now, Kaspa continues to respect clear price levels instead of moving erratically.
Market Indicators Point to Controlled Strength
Volume spiked during the breakout, pointing to strong buying interest rather than a low-liquidity move. While activity has eased since then, it’s still higher than before suggesting quiet accumulation.
Rising open interest shows new positions are coming in, supporting the bullish setup but also increasing the chance of sharper swings if leverage builds up. Overall, momentum looks firm but not overheated.
Read Also: Why Trump Moved on Venezuela and What It Could Mean for Bitcoin and Crypto
Kaspa Price Short-Term Outlook for This Week
Kaspa starts the week in a technically important zone.If KAS stays above the $0.047–$0.048 zone, another push toward $0.050, and possibly $0.052 , remains in play.
Volatility has cooled after a recent spike, a setup that often comes before a strong move.Volatility is settling after the surge. A break above $0.05 could attract buyers, while a pullback to $0.046 stays healthy – only $0.044 would be a concern for the Kaspa price.
Momentum is gradually improving, price action remains controlled, and key levels are clearly defined. This looks like a week where the chart itself will drive the next move.
Volatility picked up after late December but is now tightening again, a pattern that often comes right before the next strong move.
Subscribe to our YouTube channel for daily crypto updates, market insights, and expert analysis.


