


EUR/USD is starting the new week with buyers in control. The pair has come a long way from the lows it hit back in late July.
It has climbed back above 1.1500, a big round number that traders watch closely. Right now, it is trading around 1.1527. That means it has erased most of the drop that started after June’s sell-off.
What turned things around? Buyers stepped in hard when the pair dipped into the 1.1360–1.1390 zone. That area held, and from there, the EUR/USD price pushed through a few resistance levels before running into selling pressure near 1.1550.
Since then, it has been mostly sideways. Traders are watching to see if buyers have enough fuel for another push up.
The main thing to watch this week is simple: if EUR/USD stays above 1.1500, the bullish setup stays alive, and higher levels come into play. But if it drops back below that line, we could see another test of those support zones that triggered the last bounce.
What you'll learn 👉
EUR/USD Chart Analysis
We took a look at the EUR/USD chart, and the setup still looks good even after last week’s run lost some steam.
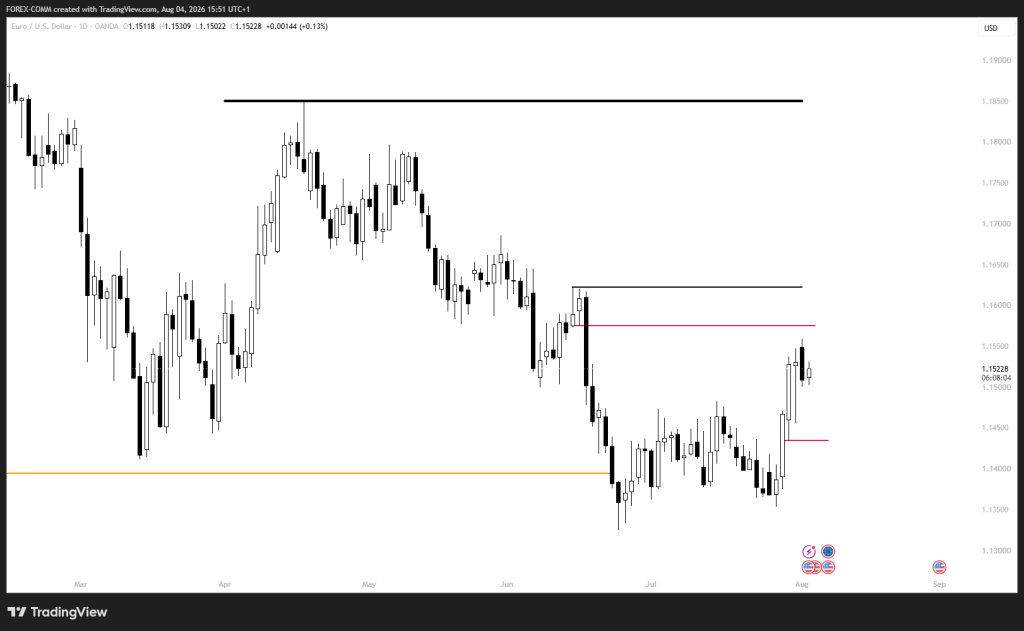
On the daily chart, the pair bounced hard off that 1.1360–1.1390 support zone and then climbed back above 1.1500. It also pushed past the old breakout level near 1.1434, and now that area is acting as support instead of resistance.
The 4-hour chart tells the same story. After that strong jump up, the EUR/USD price has been moving between roughly 1.1500 and 1.1555 over the last few days. That tells us buyers are holding onto their gains, not giving them up right away.
Read Also: Crypto Price Prediction for Today, August 4: Cardano (ADA), XRP, and Avalanche (AVAX)
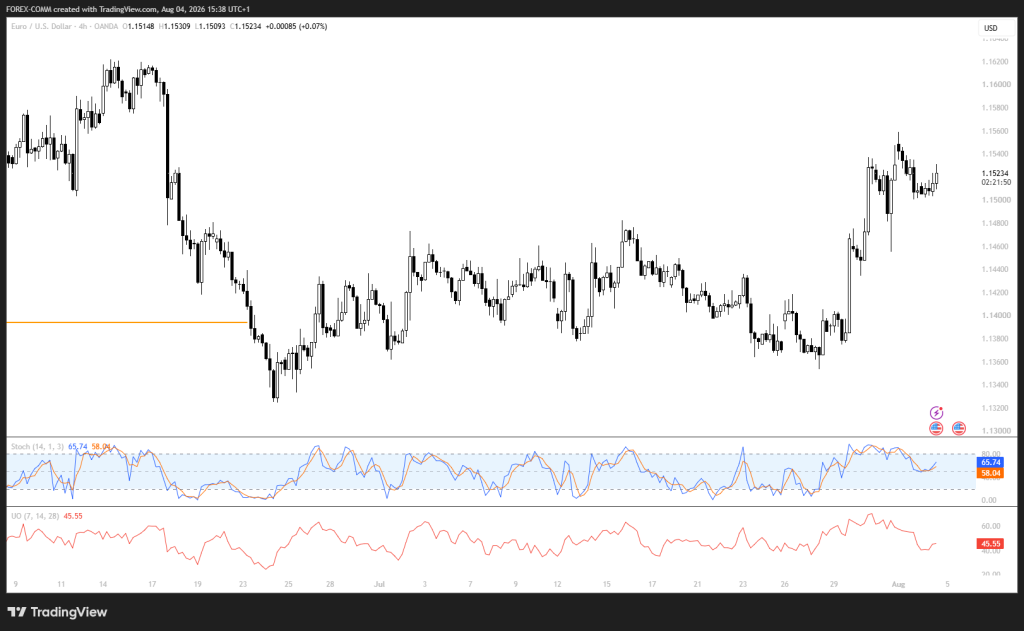
The momentum gauges have cooled down a bit but have not turned negative. The Stochastic is around 65, coming down from overbought territory, and the Ultimate Oscillator is near 45, which points to neutral momentum rather than heavy selling. So overall, this looks like a healthy pause after a solid move up.
$EURUSD Price Key Levels to Watch This Week
The first support to watch is 1.14342. That is the old breakout zone we saw on the daily chart. If price stays above that, buyers stay in charge, and the pattern of higher lows from the late-July bounce stays intact.
On the upside, the first resistance is 1.15742. That lines up with a monthly imbalance you can see on the bigger picture charts. If price pushes through that, the next stop is 1.16211, where sellers have stepped in before.
Break past both, and the bullish case gets stronger. That would also put the June highs back on the table.
Read Also: Claude AI Predicts Bitcoin Will Blow Past Its All-Time High by End of 2027
Macro Events That Could Move EUR/USD
This week’s economic calendar has several releases capable of driving volatility in the EUR/USD price. Wednesday gives us two early reads on the U.S. economy: the ADP jobs report and the ISM Services PMI. One tells us about hiring, the other about how the service sector is doing.
Thursday brings weekly jobless claims, another look at the labor market before the big one on Friday.
Friday is all about Non-Farm Payrolls. Economists are looking for 85,000 new jobs, up from last month’s 57,000. They also expect average hourly earnings to rise 0.3% from last month, and we will get the latest unemployment number too.
If the jobs numbers come in stronger than expected, the dollar could get a boost, and that might push EUR/USD lower. Weaker numbers? That opens the door for another leg up.
And keep an ear out for any Fed or ECB officials speaking. Their comments could shape what people think about where interest rates are headed next.
EUR/USD Price Prediction: The Next 7 Days
Looking at the bigger picture, it feels like EUR/USD has one more push higher in it, toward that monthly imbalance near 1.15771, before we see a bigger move either way. If buyers can take that level, the pair might test 1.16211.
But here is the catch. The daily chart shows that the same area lines up with a major supply zone. If sellers defend that monthly imbalance, the EUR/USD price could turn back down toward 1.14342, and if that breaks, the next stop lower is around 1.13537. That is the demand zone that sparked the last bounce.
For now, as long as price holds above 1.14342, buyers have the edge. The real test comes near 1.15771. How price behaves there will tell us if buyers stay in control for another week, or if sellers take over as we head into the second half of August.
Frequently Asked Questions
Subscribe to our YouTube channel for daily crypto updates, market insights, and expert analysis.






