Sei keeps making big moves behind the scenes. The network is scoring integrations with major institutional players like Apollo, Robinhood, and even BlackRock’s Kaiko.
That signals strong confidence in Sei as a fast settlement layer for real-world assets and on-chain finance. But when you look at the SEI chart, you wouldn’t guess any of that momentum is happening.
CryptoBusy pointed out this unusual gap between strong fundamentals and slow price action. He says this kind of divergence doesn’t usually last long, and something eventually has to give.
What you'll learn 👉
SEI Has Been Forming a Falling Wedge for Months
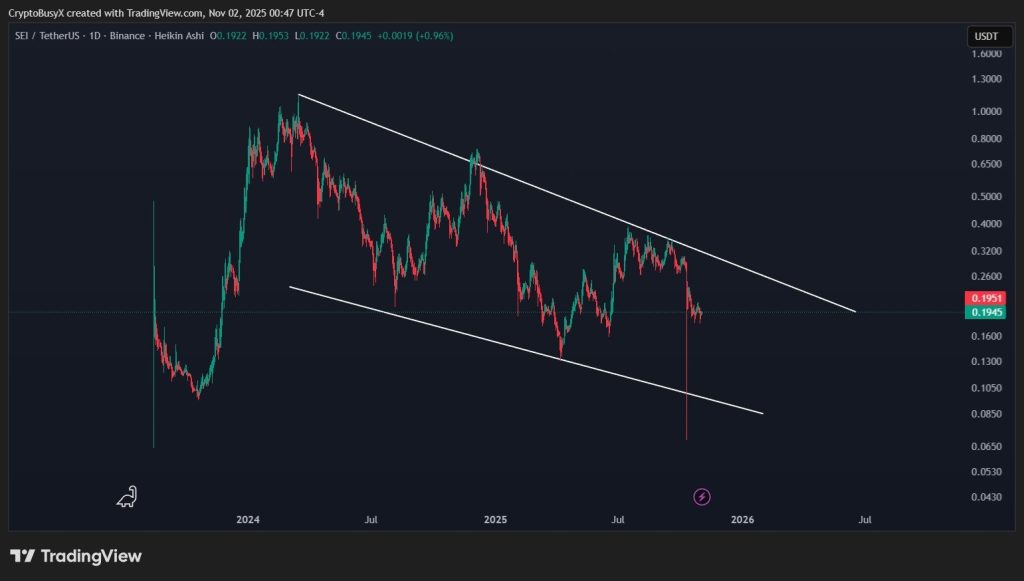
The daily chart shows the price of Sei stuck inside a long falling wedge, which means that buyers keep stepping in a little bit earlier each time and that sellers push highs lower, a slow squeeze that will eventually force a breakout one way or another.
At the moment, Sei is sitting near the lower boundary of that wedge around the $0.19 area. That’s where the price has consistently found support throughout this pattern. It’s usually the spot where early buyers start taking positions before any upside move.
Read Also: Here’s Where SEI Price Could Head as Institutions Flood Into the Network
The SEI Breakout Area Is Clear
CryptoBusy pointed out the zone everyone is keeping an eye on: the area between $0.26 and $0.30. A break above that resistance range would confirm a major shift in momentum.
That would indicate the end of the compression phase and that buyers are prepared to drive a bigger recovery move, provided the price of SEI finally manages to push through and hold above that area.
There’s still a risk here. Losing the lower wedge trendline would break the pattern entirely and likely delay any meaningful recovery. That would put sellers back in the driver’s seat. But as long as SEI’s price keeps bouncing inside the wedge, the setup remains intact.
How High Could Sei Go?
If the breakout confirms, the first target sits around $0.40. That’s where the chart last saw heavy trading before the big downturn. It’s a logical place for a relief rally to gravitate toward once bulls take control.
A move back to that level would be a strong signal that Sei is finally responding to everything happening fundamentally, not just drifting sideways.
Sei is in a pretty interesting spot. Institutions are getting involved. Utility continues to grow. And technically, the chart looks like it’s reaching the end of a long compression phase.
So now the big question is whether Sei price can flip that $0.26–$0.30 region into support. If buyers manage to do that, the chart points directly toward a move to $0.40, and possibly more as momentum builds.
Subscribe to our YouTube channel for daily crypto updates, market insights, and expert analysis.