
JasmyCoin (JASMY) price has been locked in a downtrend for much of the year, moving inside repeated descending channels. Every time the token tries to rally, sellers push it back down.
Now the chart is showing signs that this pattern could be nearing a key turning point, which has drawn the attention of a crypto analyst Jonathan Carter on X. His view is that JasmyCoin may be setting up for a breakout, with possible upside levels ahead.
JASMY Price Stuck Under a Major Resistance
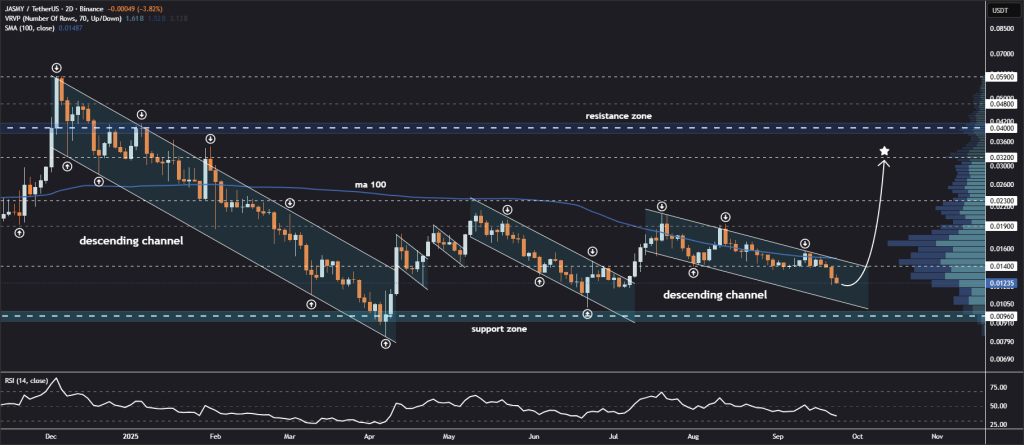
The 2-Day chart from the analyst shows JASMY trading inside another descending channel, a pattern where price keeps making lower highs and lower lows. This keeps the market tilted downward, at least until the channel breaks.
Above price sits the MA 100, a moving average that has acted as resistance multiple times. Each time JASMY approaches that line, it struggles to move past it. This makes MA 100 an important barrier to watch.
A descending channel doesn’t last forever. When the price finally breaks out of it, the move often comes quickly, especially if there’s strong volume behind it.
Jonathan Carter points out that JasmyCoin has been bouncing between support and resistance inside the channel for weeks. A clean break above could shift momentum and attract new buyers. Without that break, price risks drifting lower within the same pattern.
Levels That Could Come into Play for JASMY Token
The chart outlines a possible scenario where JASMY breaks through the MA 100 and begins moving toward higher levels. The resistance zone above is clear, with potential targets around $0.019, $0.023, and $0.032.
These are areas where sellers might appear again, but they also serve as waypoints if momentum builds. The support zone below gives structure to the chart, showing where buyers have consistently stepped in to protect price.
Read Also: Why Kaspa (KAS) Might Be the Best Bet in Crypto Right Now
Traders watching JASMY will want to see a decisive breakout above both the descending channel and MA 100. Rising volume at that point would strengthen the case for a move higher.
The RSI indicator, sitting near the lower half of the scale, suggests momentum has room to recover if price begins climbing. A push above the midline on RSI would be another sign of improving strength.
Subscribe to our YouTube channel for daily crypto updates, market insights, and expert analysis.
Subscribe to our YouTube channel for daily crypto updates, market insights, and expert analysis.