

KAS price trades near $0.053 after a sharp mid-October breakdown and a slow recovery attempt. Price bounced from $0.045 support but continues to face resistance near $0.060.
Moreover, recent developments added both bullish and cautionary signals. Whale accumulation returned near $0.06 while derivatives shifted in favor of buyers.
At the same time, a minor ProBit delisting and delays in Kaspa’s smart contract roadmap kept sentiment from fully recovering.
What you'll learn 👉
What the KAS Chart Is Showing
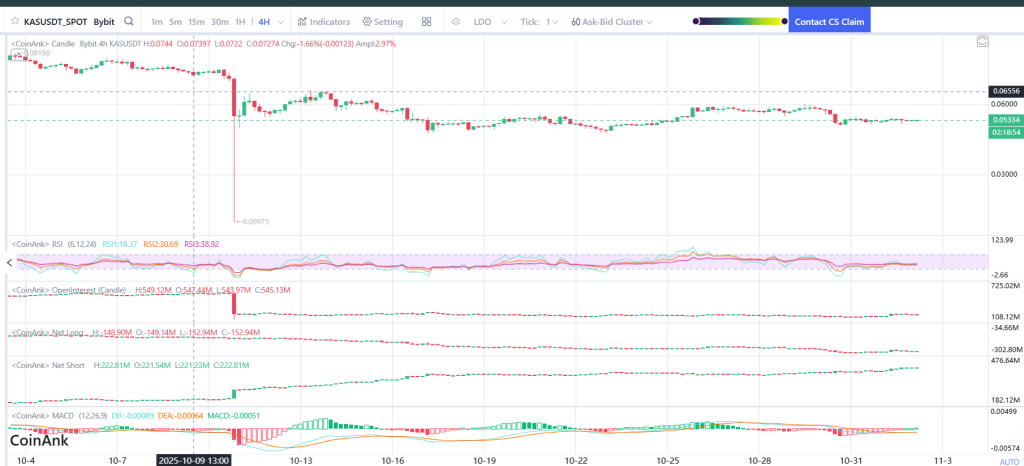
The 4H chart shows Kaspa price inside a defined consolidation range between $0.050 and $0.060. Buyers stepped in aggressively after the flash crash toward $0.045, but the rally stalled below the previous support-turned-resistance level. Every attempt to break higher fades before reclaiming the lost channel.
The long wick beneath $0.045 reflects deep liquidity interest at lower levels. However, the market continues rejecting upside when price approaches $0.060. That level now forms the key breakout zone for this week. A close above it would open a fast move toward $0.065 and $0.070.
Volume remains relatively stable during the sideways grind, suggesting traders are preparing for the next strong move. Until the chart confirms direction, KAS price remains in a neutral structure following a volatility reset.
Market Indicators
RSI hovers around the 50 zone on the 4H chart. This reflects equilibrium between buyers and sellers with no dominant momentum.
MACD trades near the zero line and is beginning to curl upward. That signals early recovery potential, though not yet fully confirmed.
Open interest dropped sharply during the mid-October liquidation but has since returned gradually. Reduced leverage risk lowers chance of another sudden breakdown.
Long-short positioning sits balanced. Neither side shows aggressive conviction.
Together these indicators show cooling pressure after the crash but no confirmed bullish continuation yet. Market sentiment is steady but waiting for decisive direction.
Read Also: Here’s How High Hedera (HBAR) Price Could Go If It Rallies 45% From Here
KAS Price Short-Term Outlook for the Week
A move above $0.060 is the key for bullish continuation. Breaking that level would target $0.065 first and then $0.070 if broader market conditions remain stable. Whale accumulation near that threshold makes it a realistic upside target.
If the Kaspa price fails to clear the barrier, consolidation may extend through the week. Losing $0.050 would expose $0.045 again as the primary support. If that zone breaks, momentum could shift back to sellers.
Kaspa’s strong throughput numbers continue to support its long-term narrative, while ecosystem delays and exchange caution are temporary headwinds. Price direction in the short term depends on whether buyers reclaim control above resistance or allow another retest of lower bids.
Holding above $0.053 keeps the door open for a push higher. A weekly close north of $0.060 would confirm that the next leg toward $0.070 has begun.
Subscribe to our YouTube channel for daily crypto updates, market insights, and expert analysis.


