
The prices of some major crypto have dropped on the board today. Bitcoin (BTC), Ethereum (ETH), Raydium (RAY), and several other coins are all down.
The total crypto market has shed over $60 billion and is now sitting around $3.31 trillion. The drop comes as investors react to yesterday’s U.S. CPI data, which showed inflation at 2.4% year-over-year. Although that figure was slightly below the expected 2.5%, it still weighed on sentiment and sparked a broader pullback in risk assets like crypto.
Much of the hesitation in the market is also coming from Bitcoin price rejection near the $110,000 mark. The leading asset dropped over 2% after failing to hold above this level, adding to the selling pressure. Ethereum followed with a similar decline, slipping below key technical support and confirming a bearish pattern.
ETF inflows have also slowed. Spot Bitcoin ETFs saw $165 million in inflows yesterday, down sharply from $435 million the day before. This drop shows waning institutional momentum as traders respond to macro signals and weakening price structure.
The market’s reaction highlights how sensitive crypto remains to inflation and economic updates. While the longer-term trend is still intact, short-term sentiment has clearly shifted.
However, let’s have a look at some technicals and what some traders are saying on X.
What you'll learn 👉
Bitcoin Price Pulls Back After Rejection at $110K
Bitcoin (BTC) is under pressure after losing momentum above the $110,000 zone. The price has dropped to around $106,900, forming a clear bearish pullback on the 4H chart. The short-term trend has flipped as the last several candles have printed lower highs and long red bodies, signaling that sellers are in control.
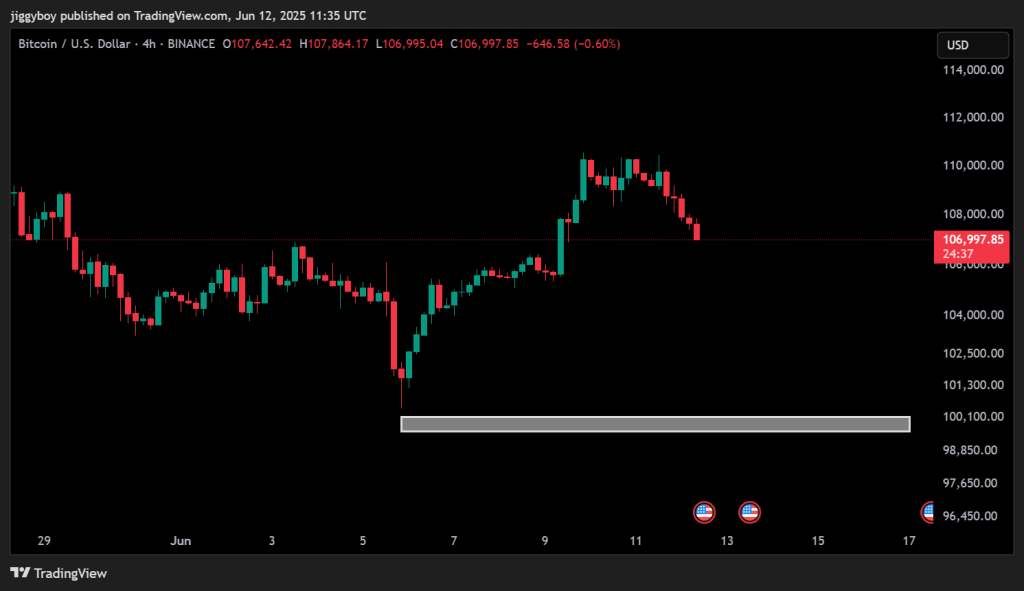
Support is found between $106,000 and $106,500, but if that fails to hold, the next major zone is between $100,000 and $101,000. This level is considered a key psychological area and previously acted as a demand zone on June 5. On the upside, $110,000 is the resistance bulls need to reclaim for any momentum to return.
Moreover, ETF flows have mirrored this price behavior. As reported by BeInCrypto, daily inflows into spot BTC ETFs dropped to $165 million from $435 million the day before, reflecting weaker demand from institutions. That loss of steam, alongside macroeconomic tension, is keeping Bitcoin pinned below resistance.
ETF Inflows Dip, BTC Stalls Near $110K
— BeInCrypto (@beincrypto) June 12, 2025
Spot Bitcoin ETFs saw $165M in inflows yesterday—still solid, but down 61% from the $435M seen June 10. 📊
BTC price hovers around $110K as momentum cools. Derivatives markets? Still bullish. ⚖️ pic.twitter.com/cpOaONCAe2
Ethereum Price Faces Breakdown After Confirming Bearish Pattern
Ethereum is seeing a deeper pullback after breaking down from a head and shoulders pattern on the daily chart. The neckline at $3,170 failed to hold, and ETH is now trading below $3,100. This move has confirmed the bearish setup, and price could head toward the $2,800–$2,600 zone if downside pressure continues.
Crypto expert Sensei posted a chart earlier on X with a simple warning: “$ETH is about to hard dump.” The pattern structure and price behavior appear to support that view. Lower highs and weaker volume leading into the right shoulder showed fading bullish interest, and the breakdown confirms the shift.
$ETH is about to hard dump pic.twitter.com/0NVy3wptJe
— Sensei (@SenseiBR_btc) June 12, 2025
Immediate resistance is now at $3,250. ETH needs to reclaim that level to reverse the current bias. Without a strong bounce, short-term sentiment is likely to remain cautious.
Read Also: How Much Will 13,500 Kaspa (KAS) Tokens Be Worth by 2026?
Total Crypto Market Cap Stalls Below $3.40 Trillion
The total crypto market cap failed to break through the $3.43 trillion resistance area and has now slipped back to $3.31 trillion. This rejection marks the second time the market has failed to hold above $3.40 trillion in June. Price action on the daily chart shows a red candle forming as volume declines, hinting at more sideways action or continued selling.
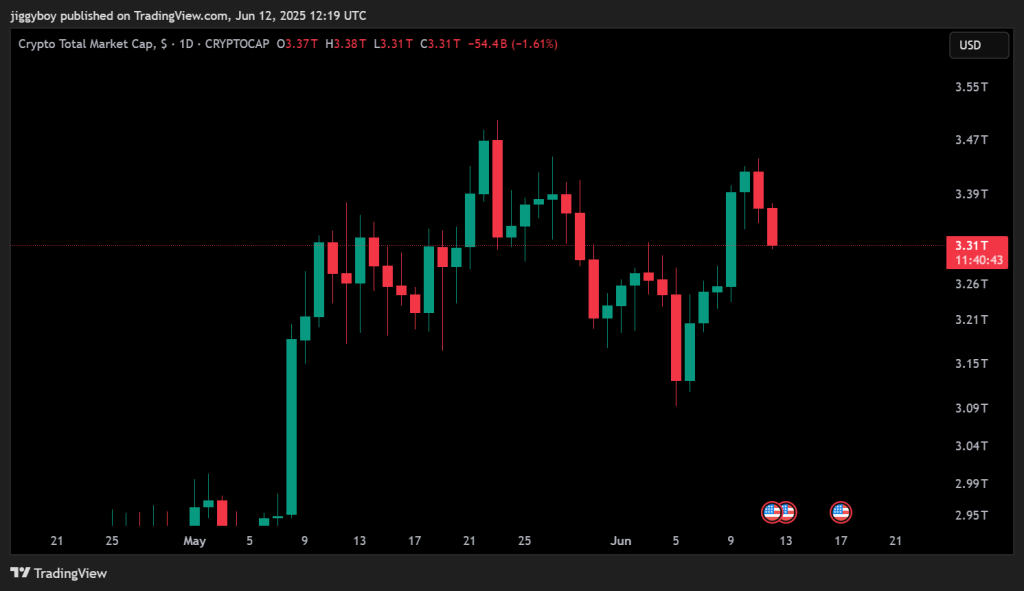
The key support level to watch is between $3.26 trillion and $3.21 trillion. If that range is lost, the next support sits at $3.12 trillion, which served as a bounce zone earlier in the month. The larger double-top structure from May remains in play, and unless bulls reclaim $3.38 trillion, the broader market may stay under pressure.
Market volume is also down by over 1% compared to the previous day, a signal of indecision among traders. Without a clear breakout, risk appetite appears to be fading across the board.
Overall sentiment is turning defensive. Traders are closely watching BTC key levels $106,000 for support and $110,000 for resistance to determine the next major move. Meanwhile, the Ethereum confirmed breakdown has placed additional pressure on altcoins across the board.
With inflation back in focus and ETF momentum slowing, the crypto market remains in a fragile position. The next few days will be key in determining whether this is just a short-term dip or the start of a deeper correction.
Subscribe to our YouTube channel for daily crypto updates, market insights, and expert analysis.

We recommend eToro
Wide range of assets: cryptocurrencies alongside other investment products such as stocks and ETFs.
Copy trading: allows users to copy the trades of leading traders, for free.
User-friendly: eToro’s web-based platform and mobile app are user-friendly and easy to navigate.