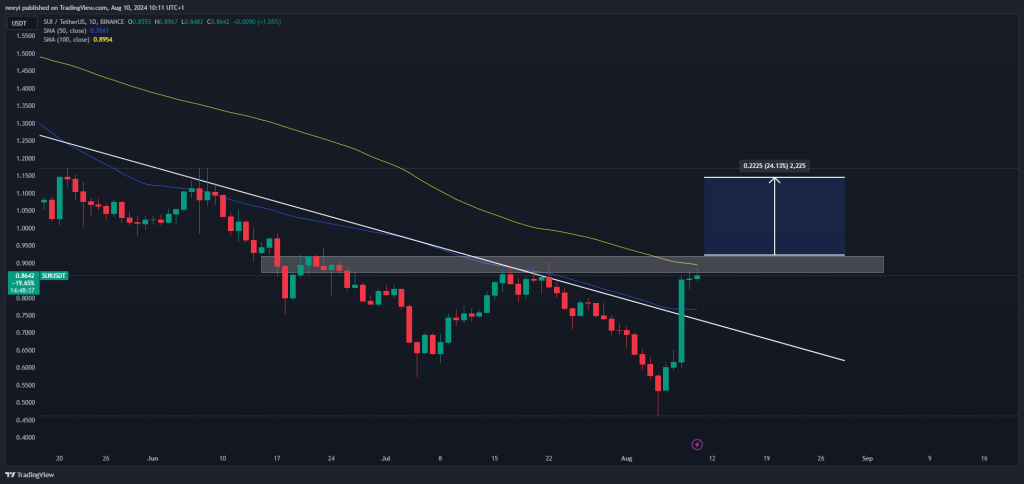
SUI broke out from a descending trendline two days ago in what was a strongly bullish signal. However, the bullish momentum that followed was not strong, with the price struggling to break above a key resistance (the white rectangle in the chart).
This setup leaves SUI with two possible scenarios in the short term:
Scenario 1: The price eventually breaks above the resistance rectangle, which is expected to make the price spike further up.

Read Also: These US Election Metrics Point to When Bitcoin Could Spike to $100,000 per BTC
Scenario 2: The resistance holds the price, and we see a retracement back to the broken trendline. At this point, buyers will be hoping the trendline holds as support.
Technical Indicators Give Bullish Hopes
The price has broken above the 50-day SMA on the daily chart. However, the 100-day SMA is still serving as resistance to further price growth, just at the point where the current resistance is holding.
Doge2014 raises 500K in days celebrating Dogecoin. Make potentially big profits and get in on exclusive airdrop!
Show more +The relative strength index is at 63, showing that there is some room for the price to run before it gets overbought. This supports the possibility of a bullish run.
So far, the current resistance at around $0.86 to $0.91 looks like the major barrier to price rally at this point. A breakout above it should trigger a 20% spike to the next major resistance level.
Subscribe to our YouTube channel for daily crypto updates, market insights, and expert analysis.
We recommend eToro
Wide range of assets: cryptocurrencies alongside other investment products such as stocks and ETFs.
Copy trading: allows users to copy the trades of leading traders, for free.
User-friendly: eToro’s web-based platform and mobile app are user-friendly and easy to navigate.


