Hedera has managed a short-term bounce off recent lows, but overall, the price action still looks heavy. After finding support near the $0.128–$0.130 zone in late June, HBAR price made a decent recovery. Still, it couldn’t push past major resistance and remains stuck below both the descending trendline and the 200-period moving average.
So, what can we expect from the HBAR price in July?
What you'll learn 👉
How Did HBAR Perform in June?
HBAR opened June trading above $0.165 but quickly fell into a steady downtrend. By mid-June, the token was already trading near $0.130, marking one of its lowest points in months.
That bounce from the $0.128–$0.130 demand area gave bulls a bit of hope, but it didn’t last long. Price ran into resistance near $0.152 and failed to break through.
Overall, HBAR price lost around 10–15% in June, with most of the trading stuck between $0.130 and $0.150. Even with a few attempts to rally, the price couldn’t build enough momentum to escape that range. The broader market recovery failed to lift HBAR meaningfully, leaving the asset lagging behind other altcoins.
Hedera Price Chart Analysis
Looking at the HBAR 4H chart, the downtrend is still dominant. At writing, HBAR is still trading beneath the 200-period SMA sitting at approximately $0.159. The most recent attempt to break out above $0.152 was rejected directly at the falling trendline, suggesting that sellers remain in control.
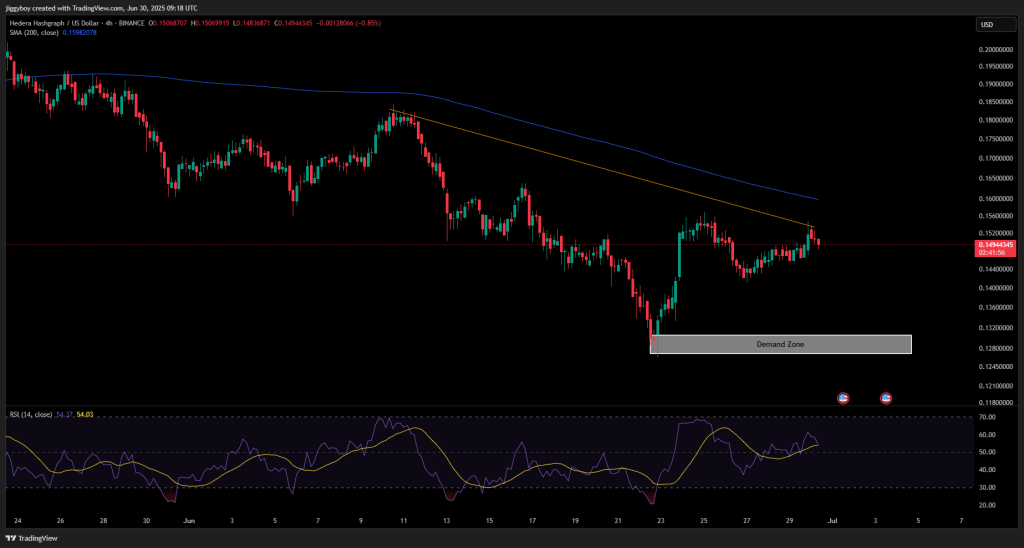
While the bounce from $0.130 was strong, HBAR price now shows signs of hesitation just under resistance. Small-bodied candles and long upper wicks suggest indecision. Key support remains at $0.144–$0.145, while a breakdown below that could trigger another drop back toward the $0.130 zone.
Technical Indicators (Monthly Timeframe)
| Indicator | Value | Signal / Interpretation |
| ADX(14) | 41.49 | Strong bearish trend in control |
| CCI(14) | -94.59 | Bearish momentum, nearing oversold |
| Ultimate Oscillator | 40.09 | Weak buying pressure, bearish lean |
| ROC (Rate of Change) | 0.302 | Slight upward movement |
| Bull/Bear Power (13) | -0.002 | Bull/Bear Power (13) -0.002 |
The monthly indicators confirm that HBAR remains in a strong downtrend. ROC is the only mildly bullish signal, possibly reflecting the short-term bounce. Still, most indicators suggest sellers are leading the market.
Read Also: Here’s Why SEI Price Can Still 10x Despite Recent 110% Pump
HBAR Price Forecast for July
Let’s look at both scenarios.
Bearish Scenario:
If Hedera price loses support near $0.144, it could slide back toward $0.130. A break below that opens the door to $0.120–$0.125. With momentum fading and no strong volume on recent rallies, this setup looks more likely unless bulls step in soon.
Bullish Scenario:
If HBAR breaks above $0.152 and flips the 200 SMA around $0.159, it could gain some traction. That would set up a potential move toward $0.165–$0.170. But for now, the market hasn’t shown enough strength to support that move.
Wrapping Up
Hedera price is still stuck below key resistance and hasn’t confirmed any trend reversal. Momentum is weak, and unless something shifts in July, the token may continue to drift sideways or lower.
Let me know in the comments, are you holding HBAR or waiting for a breakout? For now, it looks like a patience game.
Subscribe to our YouTube channel for daily crypto updates, market insights, and expert analysis.