The past few weeks saw HBAR trade between $0.21 and $0.27, a tight range that could have traders watching for which side wins. WorldofChart and Butterfly, two crypto analysis pages on X, each shared clear takes on what could follow. Chart analyses from both sources give a useful way to think about possible scenarios.
The range between $0.21 and $0.27 looks like consolidation after a prior move. Consolidation of this sort often acts as either a pause before continuation or a base that needs to hold if bulls want a larger move.
What you'll learn 👉
World of Chart’s Explanation for Hedera Price
World of Chart posted that HBAR price can fly after breakout and that a 30% rally is possible while waiting for breakout. The chart from World of Chart marks a measured move of about 28% from the breakout region.
Chart shows a descending wedge structure that contained price and a horizontal level that acted as a short term pivot. Break above the wedge and pivot creates a clear target area shown by the blue box on the chart.
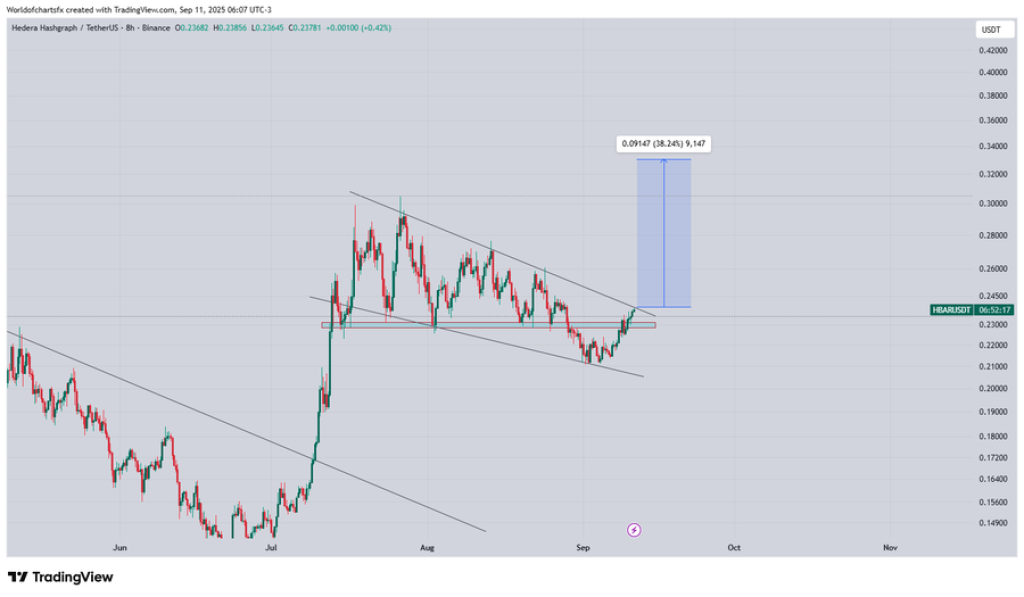
Volume behind the move on World of Chart chart matters. Spike in volume at breakout confirms participation. Breakouts that occur without volume often give a false signal. Confirmed breakout above the marked pivot would match World of Chart call that a roughly 30% swing could be realistic from current level.
Butterfly’s Bullish Flag Take and Its Chart for Hedera price
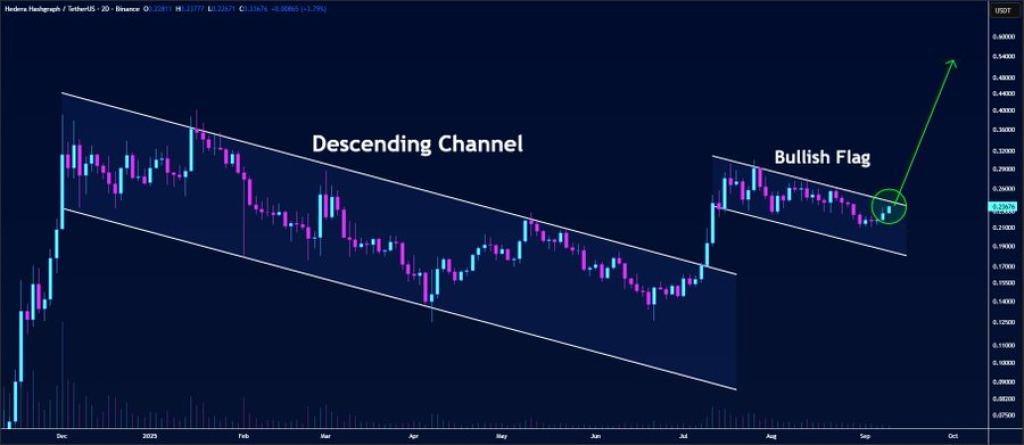
Butterfly described HBAR as consolidating inside a bullish flag pattern on 2D timeframe and said momentum indicators show bullish tilt while pressure builds underneath.
Butterfly suggested that if bulls keep control HBAR price could push toward $0.54. Attached annotated chart labeled Descending Channel and Bullish Flag shows a clean flag formation following a strong run up.
Flag pattern forms when price pulls back inside a tight channel after a sharp rally. Flagpole height projected from breakout gives the upside target, which explains Butterfly calling for $0.54.
Confirmation here needs a breakout above flag resistance on decent volume and a follow through candle or two. Failure to break or a rejection at resistance could keep price in range and delay any large move.
Flag pattern is a classical continuation pattern, and measured targets are mechanical. That makes it easy to see how Butterfly arrived at $0.54 as a projection from flagpole length.
Technical Indicators for Hedera Price — What the Numbers Say
| Name | Value | Action |
| RSI (14) | 66.276 | Bullish momentum, nearing overbought |
| STOCH (9,6) | 79.249 | Strong upside momentum |
| MACD (12,26) | 0.002 | Slight positive momentum |
| ADX (14) | 53.865 | Strong trend strength present |
| CCI (14) | 122.5202 | Buying pressure strong |
| Bull/Bear Power (13) | 0.0025 | Buyers a bit stronger than sellers |
The data above was obtained from investing .com and it shows RSI sitting above 60 suggests buyers have the edge but shows room before extreme overbought conditions. Stochastic near 80 supports that view and signals momentum is leaning up. Small positive MACD shows momentum in favor of bulls but not yet a runaway move.
High ADX over 50 indicates the move currently has strength, which is a positive sign for continuation patterns like flag breakouts. CCI above 100 points to elevated buying pressure. Bull Bear Power slightly positive confirms buyers hold a small edge.
What Must Happen Before HBAR Price Can Stage the Next Rally
First requirement is clean breakout above resistance near $0.27 that holds as support after breakout. Next requirement is decent volume behind breakout to confirm real buying interest.
Read Also: Here’s What Could Happen to Bittensor (TAO) Price If This Bullish Setup Plays Out
The third requirement is that technicals continue to align, meaning RSI and MACD keep showing momentum while ADX stays elevated rather than fading. World of Chart scenario lines up with a measured move of about 28 to 30 percent if breakout is confirmed.
Butterfly scenario uses flag mechanics to point to a larger measured target around $0.54 should that pattern play out and hold.
Subscribe to our YouTube channel for daily crypto updates, market insights, and expert analysis.