
Gold just made history. For the first time ever, XAU/USD surged past $4,200, marking a fresh all-time high and extending one of the strongest multi-year uptrends in its modern history. But as with every major rally, the question traders are asking now is: Is this sustainable – or are we due for a healthy correction?
Crypto Patel, one of the most followed technical analysts on X, believes gold might soon retrace back to the $3,000–$2,500 range, aligning with the 0.382 Fibonacci retracement level on the macro chart. That’s a bold call – but does the data actually back it up? Let’s break it down.
What you'll learn 👉
Gold’s Multi-Decade Rally: A Perfect Parabola
Looking at the long-term chart, gold’s price action since the 1970s shows a clear pattern of parabolic climbs followed by deep, multi-year corrections. The metal first peaked near $875 in 1980 before collapsing by nearly 70%, spending almost two decades consolidating below $500.
Then came the explosive bull run of the 2000s, driven by global uncertainty and quantitative easing, which sent gold from around $250 in 2001 to nearly $1,920 in 2011 – a 670% rally. What followed was a textbook correction, bottoming around $1,050 in 2015.
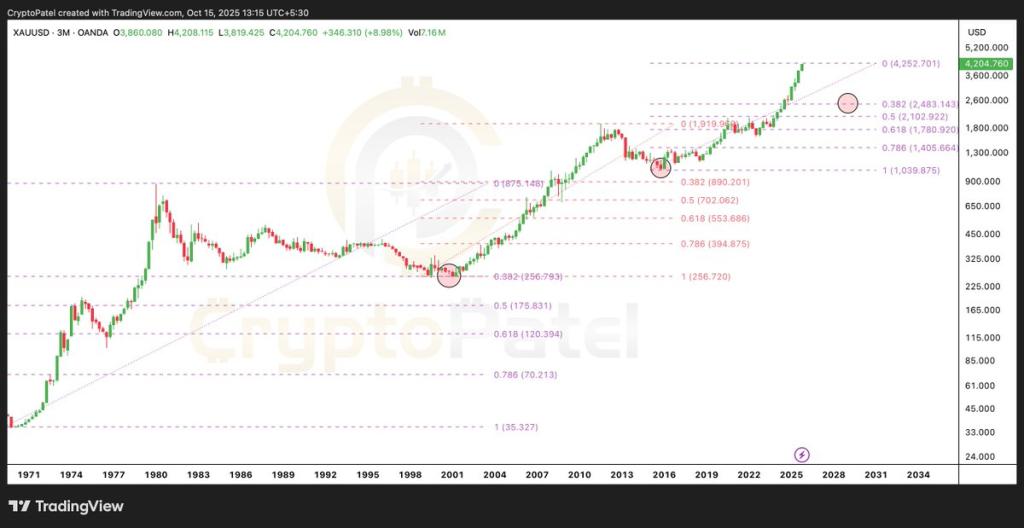
Now, in this latest leg, gold has climbed from that 2015 low near $1,050 to over $4,200, a nearly 300% rise in just ten years. The structure on Patel’s chart clearly shows that each bull cycle tends to overextend before revisiting a key Fibonacci retracement zone – typically between the 0.382 and 0.5 levels.
That’s exactly why he’s pointing at $3,000–$2,500 as a potential “cooling zone.” Historically, that’s where gold has paused before resuming its long-term ascent.
GOLD Price: Support and Resistance Zones on the Chart
The chart shows major resistance sitting around $4,250 – the current all-time high. Above this, there’s little historical structure, meaning any move higher would likely be speculative or momentum-driven.
The first strong support zone now lies near $3,800–$3,600, which aligns with the previous breakout level. If gold starts losing that area, a deeper pullback toward $3,000–$2,800 becomes more realistic. The $2,500 region, meanwhile, sits at the 0.382 Fibonacci retracement level, which Patel highlights as a historically reliable reaccumulation zone.
But here’s the key point – such a move would represent roughly a 40% drop from current levels. And that kind of correction hasn’t happened in nearly a decade. The 2012–2015 bear phase was the last time gold experienced that magnitude of decline. Since then, even during heavy macro volatility, gold’s largest retracement was around 25%.
So, while a correction to $3,000 is plausible, a deeper crash toward $2,500 would likely require an extreme catalyst – perhaps a major rate hike cycle or a sudden reversal in global risk sentiment.
Why This Pullback Might Be Different
Patel’s analysis suggests that if gold revisits that lower Fibonacci band, it could set up the next major bull phase, similar to what we saw in 2018 before gold’s rally to $2,000. In other words, the short-term pain could be long-term gain.
Still, it’s worth noting that macro conditions are shifting. Global inflation remains sticky, central banks are diversifying reserves into gold, and demand from China and India continues to grow. Those fundamentals might make a 40% drop less likely this time around.
A more reasonable base case could be a moderate retracement toward $3,200–$3,000, followed by consolidation before another leg up.
Subscribe to our YouTube channel for daily crypto updates, market insights, and expert analysis.