
Gold pushed above $5,300 per ounce for the first time in history, which is a new record during a week when risk assets were under pressure. Bitcoin dipped below $88,000 earlier in the week but quickly stabilized, now trading just under $90,000. The key point is not the intraday volatility, but the fact that Bitcoin held structure while gold made a historic extension.
This exact relationship is what analyst Sykodelic showed in his recent chart. The visual compares three markets side by side on a monthly timeframe: gold, Bitcoin, and the BTC/GOLD ratio. When aligned, the sequence across cycles becomes very clear.
Start with gold. In both 2016 and 2021, gold entered a strong directional move first. Those rallies were persistent, lasted months, and ended with exhaustion near cycle highs. During those same periods, Bitcoin did not trend aggressively. Instead, it moved sideways, forming broad ranges with declining volatility. That consolidation phase is visible again now.
Next is the BTC/GOLD ratio, which matters more than either asset alone. In prior cycles, the ratio stalled while gold rallied. It chopped inside defined boxes, showing that Bitcoin was not outperforming gold during that phase. Only after gold topped did the ratio reverse higher, marking the start of Bitcoin’s relative strength phase.
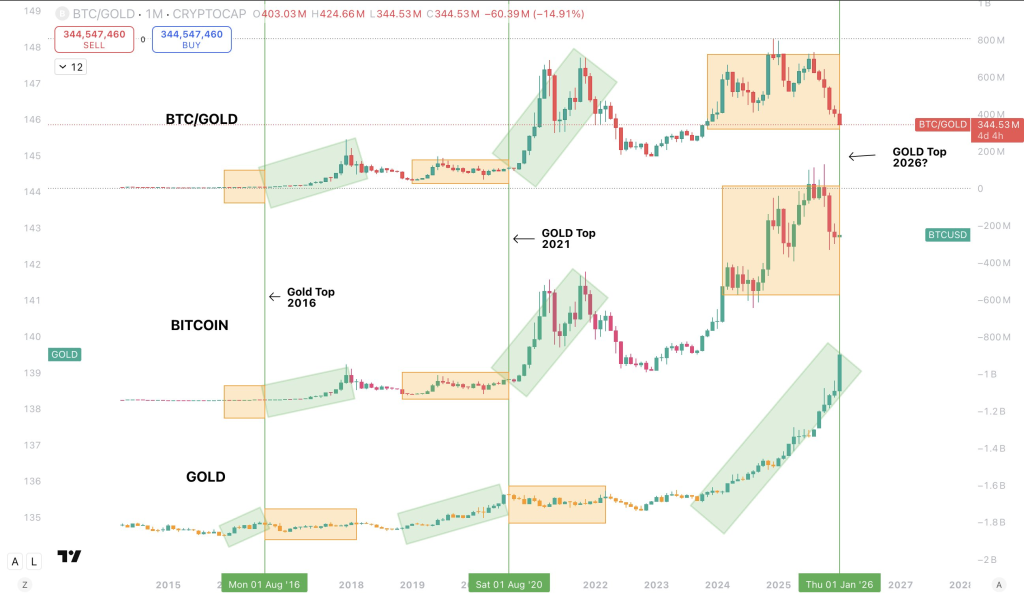
The current BTC/GOLD structure matches that behavior closely. The ratio has rolled over from recent highs and is now compressing inside a range, almost identical to the consolidation zones seen before the 2016 and 2021 Bitcoin expansions. This is the same pause that occurred before Bitcoin’s largest upside moves.
Bitcoin’s own chart supports that interpretation. In both prior cycles, Bitcoin formed rising bases while gold peaked. Price action was uneven and frustrating, but downside was limited. That is what is happening now. Despite sharp headlines around metals and macro stress, Bitcoin has not lost its higher-timeframe support or entered a sustained downtrend.
What this chart does not show is Bitcoin collapsing alongside gold. That narrative has appeared many times in the past and failed each time. Historically, Bitcoin has not followed gold lower after major gold tops. Instead, capital rotated out of metals and into Bitcoin once gold’s trend matured.
The key takeaway from Sykodelic’s chart is timing, not prediction. Gold leads first. Bitcoin waits. Then leadership flips.
Gold reaching $5,300 does not invalidate Bitcoin’s cycle. If anything, the historical pattern suggests Bitcoin is still in the same pre-expansion phase seen before its previous parabolic runs. Whether gold tops this month or later is unknown, but the chart makes one point very clear: Bitcoin’s strongest moves have consistently come after gold finishes its primary rally.
That rotation, not correlation, is what the chart is showing.
Read also: Why Gold and Silver Are Exploding at the Same Time – And What It Signals for Markets
Subscribe to our YouTube channel for daily crypto updates, market insights, and expert analysis.