Gold and silver face different tests today after several sessions of consolidation. Gold remains inside a defined range, but silver is testing whether its recent floor can hold. That difference matters for October 29 price predictions, as the next moves could depend on whether support survives or resistance finally gives way.
The chart levels and indicator readings provide a useful framework for both metals. Gold has a more balanced setup, although sellers retain some control. Silver’s weaker readings make its attempted support break particularly important.
What you'll learn 👉
Gold Price Consolidation Keeps $4,023 And $4,068 In Focus
A look at the gold chart shows that price has traded mainly between $4,023 and $4,068 since Tuesday afternoon. Moves toward the upper boundary have met resistance, and declines toward the lower boundary have found support.
Repeated reactions at these levels establish clear boundaries for today’s gold price prediction. Another move inside this range would extend the consolidation without confirming a fresh direction.
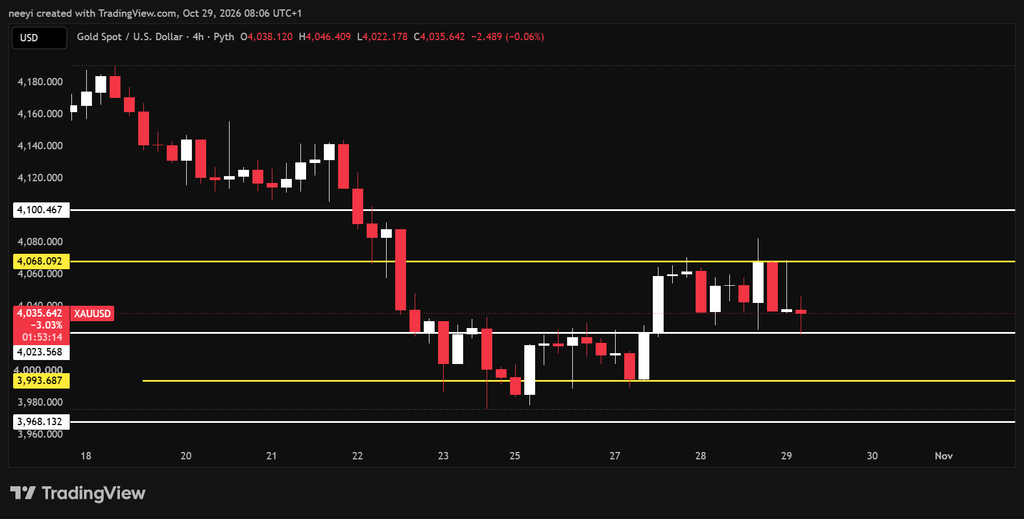
A break below $4,023 could expose $3,990 as the next downside target. Continued selling below that level would bring $3,960 into consideration. A brief dip beneath support would carry less weight than sustained trading below it.
Gold would need to clear $4,068 to improve its immediate outlook. A sustained breakout could open the door toward $4,100 before the session ends, although that target remains conditional on buyers overcoming resistance.
Gold Indicators Show Balanced Momentum And Some Selling Pressure
Gold’s RSI reading of 45.871 is close to the midpoint, although its position below 50 gives sellers a modest advantage. The Stochastic reading of 48.559 also points to relatively balanced momentum, consistent with the recent consolidation.
The negative MACD reading of −9.043 adds a weaker element to that picture. Bull/Bear Power also remains negative at −10.1896, which indicates that sellers retain pressure despite the range holding.
Together, these readings support caution about assuming an upside breakout before price confirms it.
| Indicator | Value | What The Reading Means |
|---|---|---|
| RSI(14) | 45.871 | Momentum remains broadly neutral with a slight bearish lean. |
| STOCH(9,6) | 48.559 | Momentum provides no clear directional advantage. |
| MACD(12,26) | −9.043 | Negative momentum supports the downside risk. |
| Bull/Bear Power(13) | −10.1896 | Sellers retain pressure inside the consolidation. |
Today’s gold price scenarios follow those boundaries:
- Bullish: A sustained break above $4,068 could put $4,100 within reach.
- Neutral: Continued support at $4,023 could keep gold between $4,023 and $4,068.
- Bearish: A confirmed break below $4,023 could expose $3,990, followed by $3,960.
Silver Price Tests Support As $51 Becomes A Downside Target
Silver price is attempting to break below support near $52.70. Continued trading beneath this level would weaken the recent consolidation and increase the possibility of a decline toward $51.
A further break below $51 could extend the decline. However, the supplied analysis does not establish another specific downside target beyond that point.
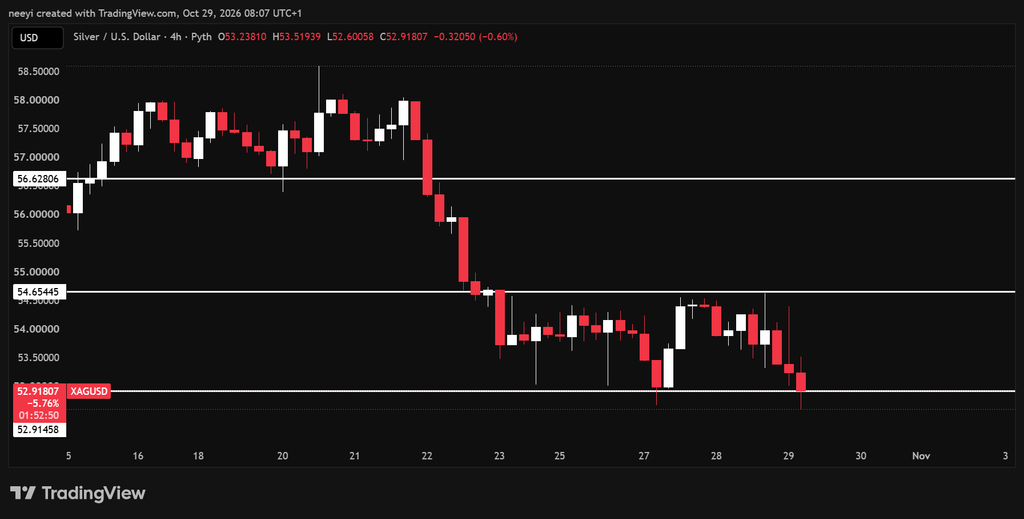
The recovery case depends first on whether the breakdown fails. A return above $52.90 could place silver back inside the area where it has mainly traded since Friday. That would leave $54.60 as the upper boundary to monitor.
A sustained break above $54.60 would strengthen the recovery case and make $56.60 the next upside target.
Read Also: Bitcoin and XRP Price Predictions for Today (October 29)
Silver Indicators Give Sellers A Clearer Advantage
Silver’s RSI of 33.828 shows weaker momentum than gold’s reading. It remains above the commonly used oversold threshold of 30, so the indicator does not establish that selling has reached exhaustion.
The Stochastic reading of 33.699 also leans bearish. Negative MACD and Bull/Bear Power readings reinforce that weakness, which supports the downside scenario if the support break holds.
| Indicator | Value | What The Reading Means |
|---|---|---|
| RSI(14) | 33.828 | Momentum is weak but remains above the oversold threshold. |
| STOCH(9,6) | 33.699 | Momentum continues to favor sellers. |
| MACD(12,26) | −0.643 | Negative momentum supports the bearish outlook. |
| Bull/Bear Power(13) | −1.3555 | Selling pressure remains stronger than buying pressure. |
Today’s silver price scenarios depend on confirmation:
- Bullish: A sustained break above $54.60 could open a recovery toward $56.60.
- Neutral: A failed breakdown and recovery above $52.90 could restore the $52.90 to $54.60 range.
- Bearish: Continued weakness below $52.70 could expose $51, with further downside possible beneath it.
Subscribe to our YouTube channel for daily crypto updates, market insights, and expert analysis.