
Gold and silver head into October 20 with noticeably different short-term setups.
Gold is trading around $4,143 on the four-hour chart after another rejection from the $4,180-$4,200 area. It has spent the past several sessions moving sideways above roughly $4,100, but momentum is starting to soften again.
Silver is near $57.30 after bouncing from the mid-$55s. Its recovery has held so far, but the chart still shows a broader pattern of lower highs and lower lows from the September peak.
So I would describe gold as range-bound with a slight bearish tilt, and silver as trying to build a base after a deeper correction.
What you'll learn 👉
Macro News Affecting Gold and Silver Today
The macro backdrop is still mixed.
The U.S. 10-year Treasury yield was around 5.09% on Monday, close to recent four-week lows after briefly moving much higher earlier this month. Lower yields can support precious metals, but markets are still pricing a meaningful chance of another Fed increase later this year because inflation remains elevated.
The dollar has also stayed relatively firm, with DXY around 101.9. That creates some resistance for both metals because gold and silver become more expensive for buyers using other currencies.
Oil is another variable worth following. Lower crude prices recently helped ease some inflation anxiety, which supported gold, but energy markets remain volatile enough to quickly change rate expectations again.
For silver, there is an extra layer. It is not only a precious metal but also an industrial commodity, so weaker growth expectations can hurt it even when safe-haven demand supports gold.
Gold Chart Analysis: Buyers Still Cannot Take Control
I analyzed the Gold Spot/U.S. Dollar four-hour chart from October 19.
Gold is around $4,143 after failing to hold recent pushes toward $4,180-$4,200.
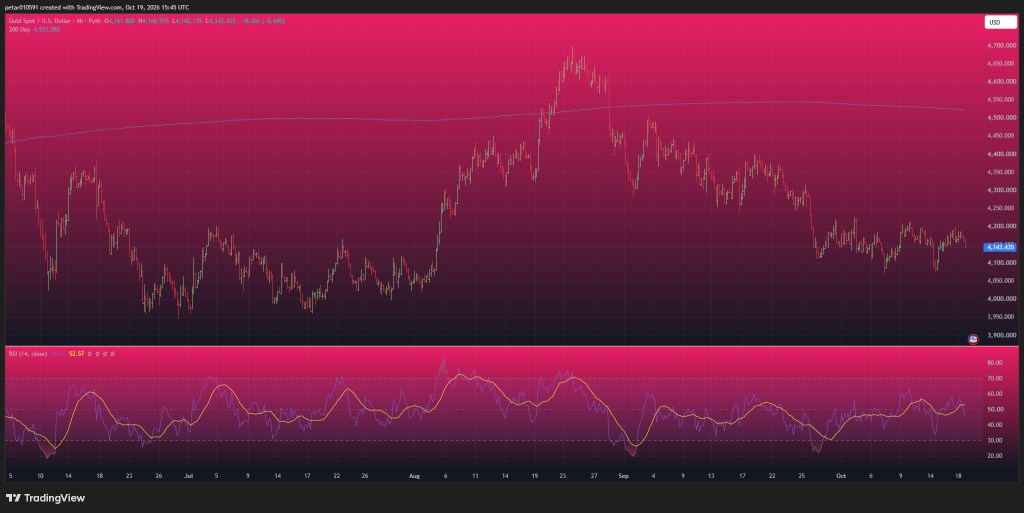
The immediate structure has become compressed. Price has repeatedly bounced from roughly $4,080-$4,100, but every move higher has stalled before creating a clean higher high.
The RSI is around 45.3, below its average near 52.6.
That tells me short-term momentum has weakened again. Gold is not oversold, so there is still room for another move lower if buyers fail to defend support.
The first level I would watch is $4,120-$4,100.
Below that, the recent reaction area around $4,075-$4,080 comes back into focus. A stronger breakdown could expose $4,040 and then $4,000.
On the upside, gold needs to recover $4,180 first. The more meaningful barrier remains $4,200-$4,220.
Another factor is the 200-day average, which is still far above price near $4,521. That keeps the broader chart technically damaged despite the repeated rebounds from $4,100.
Read also: ChatGPT Predicts Where Gold Price Could by the End of 2026
Silver Is Stabilizing, but the Trend Has Not Reversed
Silver is trading around $57.30 on the four-hour chart.
The recent low near $55-$56 attracted buyers, and price has managed to rebound toward $58, but the recovery has so far remained relatively shallow.
The silver chart still shows a series of lower highs from the September area near $69-$70.
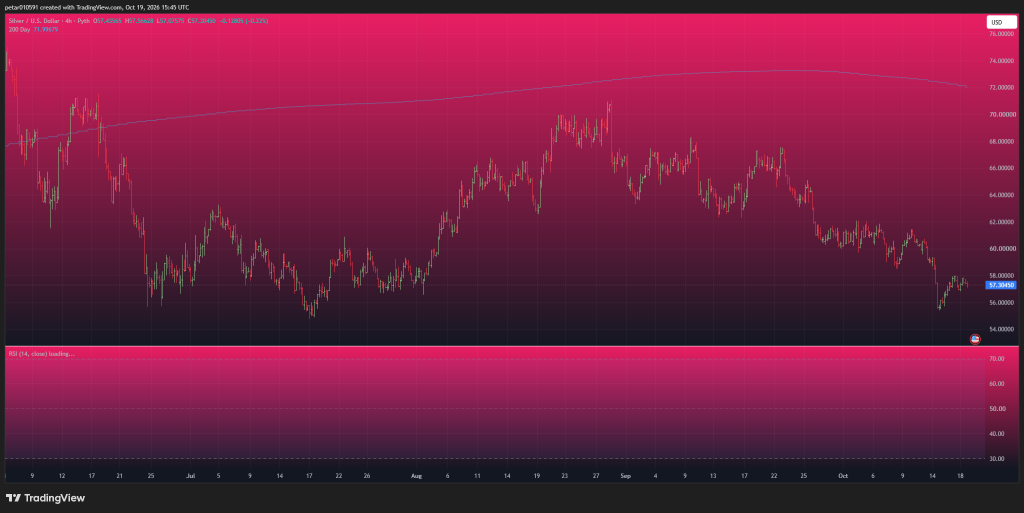
That means I would not call this a confirmed reversal yet.
The first important upside zone is $58-$59. If silver can clear that area, $60 becomes the next psychological test.
Above $60, the chart opens toward roughly $61.50-$62.
On the downside, $56 is the key area to defend.
A clean loss of $55-$56 would put $54 back in play and could eventually reopen the path toward $52.
Silver also remains well below its 200-day average near $72, which tells us how much ground bulls still need to recover before the larger trend looks healthier.
Gold and Silver Price Predictions for October 20
For today, I would frame both metals around these conditional paths:
| Metal | Bullish scenario | Neutral scenario | Bearish scenario |
|---|---|---|---|
| Gold | Recover $4,180 and clear $4,200 → $4,220-$4,250 | $4,100-$4,180 | Lose $4,100 → $4,075-$4,040 |
| Silver | Clear $58-$59 → $60-$62 | $56-$59 | Lose $55-$56 → $54, then $52 |
Gold still looks technically stronger than silver to me, mainly because buyers have defended the $4,100 area several times.
But I do not like the fact that gold keeps failing around $4,180-$4,200 and RSI has slipped back below 50.
Silver has more rebound potential in percentage terms, but it also carries more downside risk if $55-$56 fails again.
For October 20, the levels I would watch most closely are $4,100 for gold and $56 for silver. If both hold, the metals can continue trying to recover. If they break, the next move likely belongs to sellers.
For more financial news and price predictions, click here.
Subscribe to our YouTube channel for daily crypto updates, market insights, and expert analysis.