
Floki has experienced a major price surge after breaking through previous resistance levels. However, the token now faces a critical resistance level at $0.000316, which must be overcome for the bullish momentum to continue.
What you'll learn 👉
Analyst Insights on Floki’s Price Action
Analyst Murfski shared his thoughts on Floki’s price action, noting that while the token overshot his final take-profit (TP) level, the core idea of his analysis was correct.
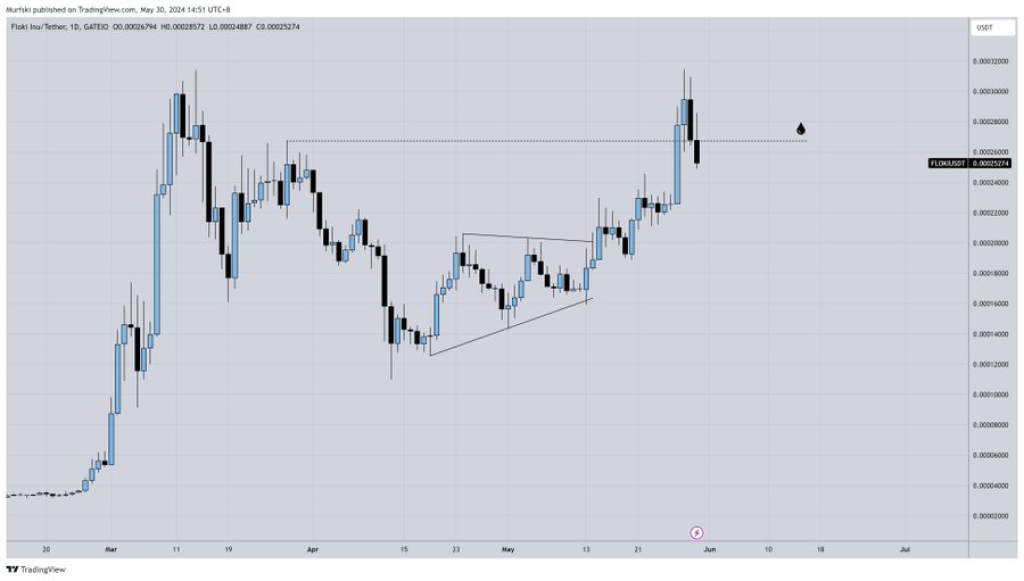
Murfski observed a sweep into a high timeframe (HTF) level of resistance followed by a rejection, emphasizing the importance of taking profits along the way. Although currently flat on Floki, Murfski expressed his intention to look for long positions again soon.
Another analyst, Dona, highlighted Floki’s nice surge after breaking previous resistance levels. Dona noted that the token is now retesting another major support/resistance (S/R) flip level, which must hold for bullish continuation.
Doge2014 raises 500K in days celebrating Dogecoin. Make potentially big profits and get in on exclusive airdrop!
Show more +Technical Analysis by altFINS
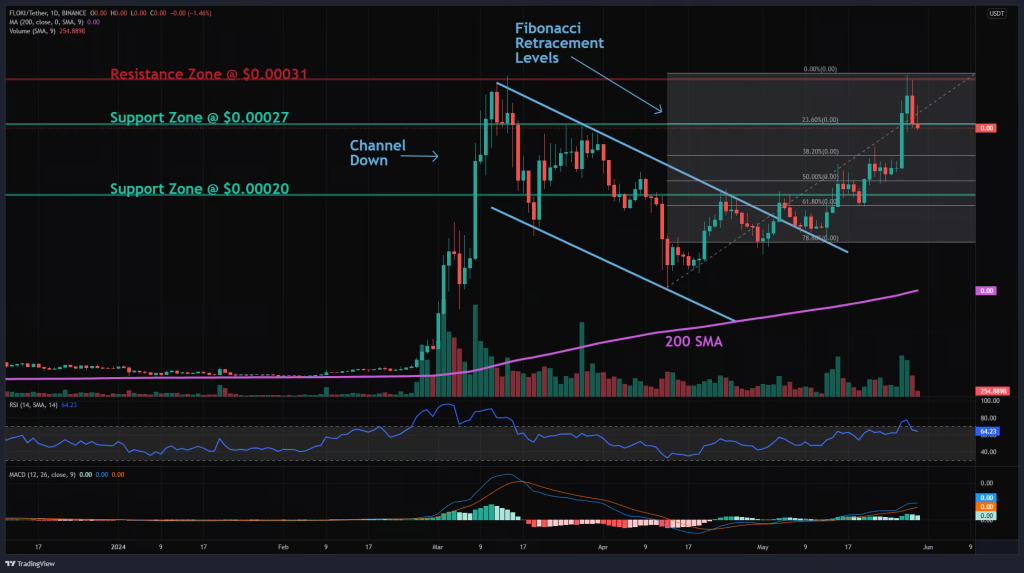
According to a technical analysis by altFINS, Floki’s near-term outlook is neutral, with the token exhibiting a “Pullback in Uptrend” pattern. The analysis suggests that following a bullish breakout from a channel down pattern, Floki has now broken above the $0.00027 level and reached the next resistance at $0.000316, where it faced rejection in March.
altFINS advises traders to look for the right entry opportunity in the ongoing uptrend, waiting for the price to find support for another swing trade entry with upside potential back to $0.000316.
Source: altFINS – Start using it today
The nearest horizontal support is identified at $0.00027 (prior resistance), which also coincides with the 23.60% Fibonacci Retracement level. Additional potential support levels are found at $0.000238 (38.20% Fibonacci Retracement) and $0.000214 (50% Fibonacci Retracement).
The technical analysis reveals that Floki’s short-term, medium-term, and long-term trends are all classified as “Strong Up.” However, the momentum is currently bullish but inflecting, with the MACD (Moving Average Convergence Divergence) line still above the MACD Signal Line.
The declining MACD Histogram bars suggest that momentum could be nearing a downswing. The RSI-14 (Relative Strength Index) levels indicate that Floki is neither overbought nor oversold at the moment.
The nearest support zone for Floki is identified at $0.0002, while the nearest resistance zone is located at $0.000316.
Subscribe to our YouTube channel for daily crypto updates, market insights, and expert analysis.
We recommend eToro
Wide range of assets: cryptocurrencies alongside other investment products such as stocks and ETFs.
Copy trading: allows users to copy the trades of leading traders, for free.
User-friendly: eToro’s web-based platform and mobile app are user-friendly and easy to navigate.


