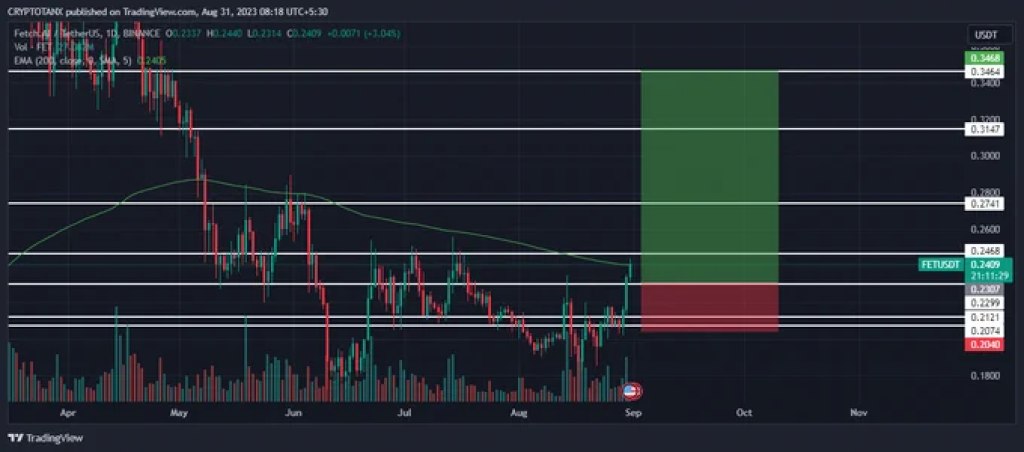
Crypto enthusiasts have lately been buzzing about Fetch.ai ($FET), a decentralized machine learning platform that has been showing some strong indicators on its trading charts. After forming a double bottom pattern on the daily chart and flipping its 200-day exponential moving average (200EMA), $FET is now positioned for a short-term price target between $0.33 and $0.35.

What you'll learn 👉
A Historical Look: Patterns That Reveal Future Potential
Red Phase: Signs of Bottoming Out
To clearly illustrate the recurrent themes in $FET’s price action, it’s essential to dissect the historical chart in color-coded phases. Initially, what catches the eye is the Red Phase, where it looks like the asset is bottoming out according to a tweet by Doji Nakamoto. Here, the rate of selling slows down and a modest relief rally emerges, only to be retraced. This is followed by a period of sideways movement—call it ‘market indecision.’
Moving on, the Yellow Phase presents itself as a trap for the over-optimistic bulls. Just when it seems like the bottom is finally in, $FET’s price takes a nosedive to fresh lows. This dip has occurred repeatedly, manifesting as a telltale sign of impending price action.
The Green Phase is what every trader and investor waits for—the meteoric rise, or as the community calls it, the “face-melting pre-pump.” The first occurrence witnessed a jaw-dropping 40x rise from the lowest point indicated by the yellow arrow, while the second surge was a more ‘modest’ 10x.
Lastly, the Orange Phase demonstrates that what goes up must come down, but it does so in a fashion that’s more of a whimper than a bang. After both major pumps, the price saw a gradual decline over an extended period—12 weeks during the first cycle and around 17 weeks in the recent one, discounting an outlier wick.
Doge2014 raises 500K in days celebrating Dogecoin. Make potentially big profits and get in on exclusive airdrop!
Show more +It’s noteworthy to mention that in both cycles, major reversal candles developed with significant wicks. The first had a wick stretching to about 40% while the second wick covered around 35% of the candle’s range. This uncanny resemblance is more than just a passing coincidence.
Considering the above patterns and assuming that history tends to rhyme, it’s not far-fetched to believe that we’ve seen the bottom in $FET. The coin has made both a rounding bottom and a higher low on a significant timescale, hallmark indicators of a bullish setup.
For the risk-takers among us, applying the past 2300% price growth to the upcoming cycle suggests a staggering future price of $4.45 for $FET. Though this is speculative, it’s not completely out of the realm of possibility given $FET’s performance in previous cycles.
As of the latest data, $FET is at a supply zone. This is a decisive moment; either the price will flip this area to become a new support or experience a pullback.
Will $FET reach the ambitious price of $4.45 in the upcoming bull run? While the past is not a perfect predictor of the future, it offers valuable lessons. Keep an eye on this digital asset, because if history is any indication, we might be on the cusp of something monumental.
We recommend eToro
Wide range of assets: cryptocurrencies alongside other investment products such as stocks and ETFs.
Copy trading: allows users to copy the trades of leading traders, for free.
User-friendly: eToro’s web-based platform and mobile app are user-friendly and easy to navigate.


