FET has quietly drifted into a part of its chart that long-term traders tend to care about a lot more than whatever happens on a 5-minute candle.
After taking a brutal hit from its cycle highs, the FET price is now sitting in an area that often separates projects that disappear from those that quietly reset and come back stronger.
So the real question isn’t whether FET is volatile. That’s a given. The question is whether this level marks the start of a real accumulation phase or just another pause before things get worse.
What you'll learn 👉
Zooming Out on the Bigger FET Picture
When you look at the higher time frame chart shared by Patel, FET has been moving inside a broad ascending channel that’s been respected all the way since 2020. That alone already says a lot.
Even after dropping almost 97% from its all-time high, the FET price didn’t completely fall apart. Instead, it made its way back to the bottom of that long-term channel and found buyers waiting there.
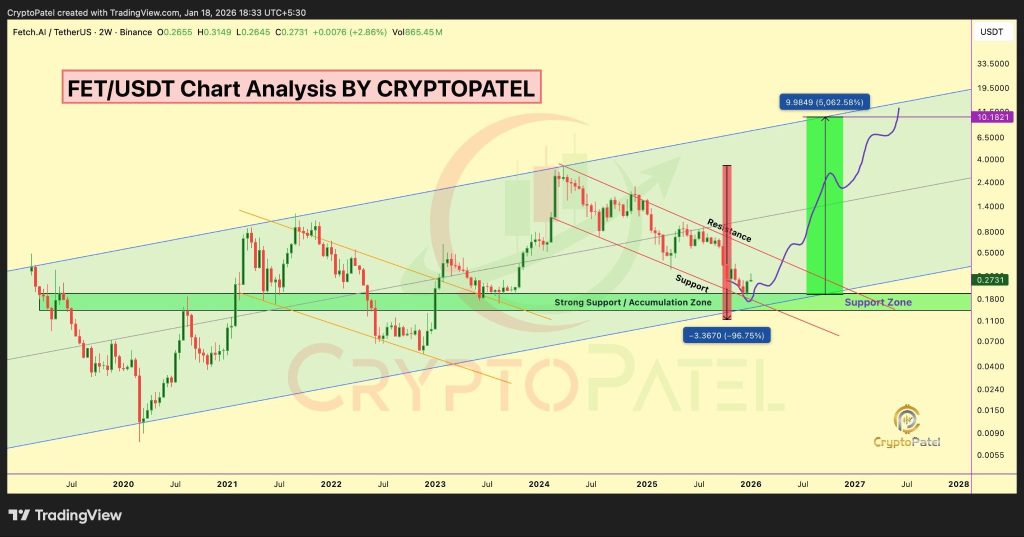
That kind of behavior usually points to a reset rather than a breakdown. When a price retraces that deeply but still holds its macro structure, it often means long-term players are stepping back in instead of walking away.
What makes this even more interesting is the demand zone around $0.19 to $0.20. That area has acted like a real floor, where price started to stabilize instead of free-falling. As long as the FET price stays above this range, the bigger bullish idea remains technically intact.
Read Also: Is Crude Oil Price About to Repeat Its Most Explosive Pattern from History?
Why This Zone Is So Important for FET
Support zones become truly meaningful when several technical factors line up at the same place, and that’s exactly what’s happening here.
The lower boundary of the long-term channel and that horizontal demand zone are basically overlapping. That kind of confluence is what longer-term traders look for because it defines risk and reward very clearly.
In simple terms, it gives the market a clean line in the sand. A higher time frame close below $0.19 would seriously weaken the setup. But as long as that level holds, the chart continues to lean bullish.
And right now, the price behavior itself is telling a story. The FET price isn’t accelerating lower anymore. It’s compressing and calming down, which is often how accumulation phases start after a major correction.
Where the Upside Could Begin to Unfold
CryptoPatel’s targets of $0.60, $1, $2.80, $5, and even $10 might sound wild at first, but when you place them on the chart, they actually line up with previous value zones and the upper boundary of the long-term channel.
A move toward $0.60 would be the first sign that the trend is shifting rather than just bouncing. From there, reclaiming $1 and the $2.80 region would bring the FET price back into areas that defined earlier cycles.
The higher targets near $5 and $10 only really come into play if the broader AI narrative and overall market conditions support a full macro recovery, not just a short-lived relief rally.
The key is to view these levels as long-term scenarios, not short-term promises. They outline what becomes possible if structure, demand, and market momentum all start working in the same direction.
As long as the FET price stays above that $0.19 macro support, the chart keeps its bullish structure. Whether that eventually turns into a true 5000% move will depend on time, execution, and the broader market cycle, but from a technical point of view, the foundation is clearly there.
Subscribe to our YouTube channel for daily crypto updates, market insights, and expert analysis.