World of Charts posted an analysis of Fantom (FTM) price action. The price analysis shows a potential breakout that can lead to a massive bullish move for FTM’s price.
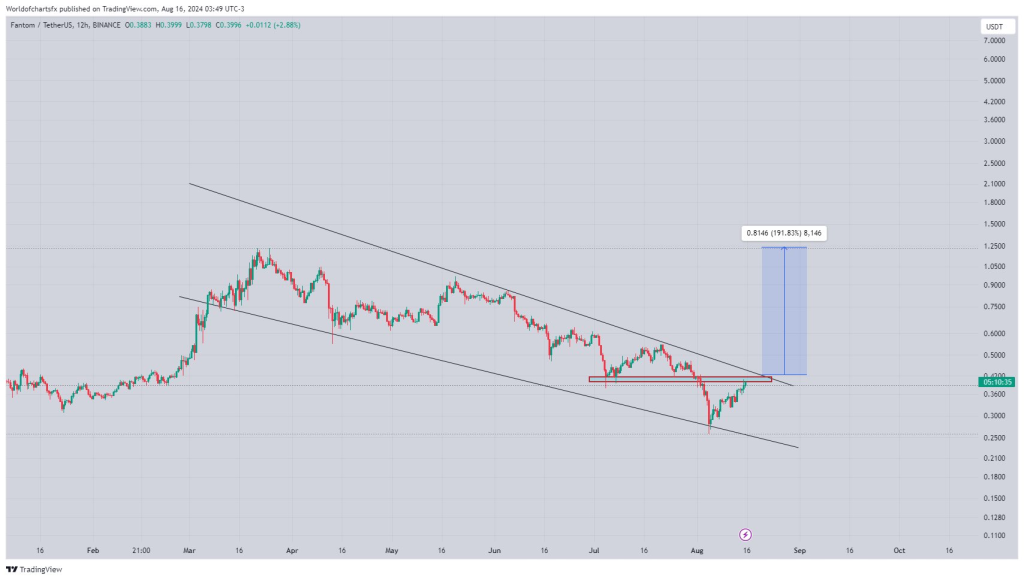
The chart shows Fantom (FTM) paired with USDT in the 12-hour timeframe. The price action has been contained within a descending channel since mid-April, characterized by lower highs and lower lows.
The channel appears to be well-respected, with multiple touches on both the upper and lower boundaries. The recent price action shows a break above a horizontal resistance level around the $0.39 area, which is a key area of consolidation.

The price has to break out of this resistance zone to start testing the upper boundary of the descending channel.
The chart shows a price target projection for FTM after a breakout above the descending channel, indicating a potential move up to around $1.25, which represents an approximate 190% increase from the current price.
This target aligns with previous support-turned-resistance areas, suggesting it could be a strong area for profit-taking.
Read Also: Kaspa (KAS) Price Reaching $3 Is Still a Bearish Prediction: Here’s Why
Traders who want to execute trades based on this setup will have to wait for a breakout of the descending channel. However, failure to break above the level could lead to a continuation of the bearish pattern.
Injective Could Spike 50% Following Resistance Breakout
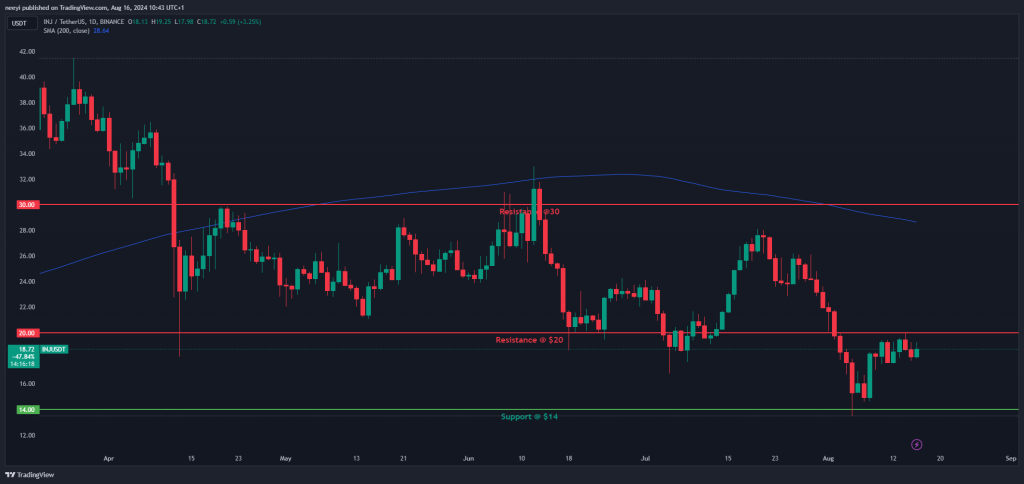
Injective’s INJ price remains in a downtrend according to technical analysis from AltFINS, below the 200-day moving average. After a bearish breakout from a sideways channel, below the $20 key level, the price dipped to $14 support.
It later became oversold below the RSI level 30 and bounced up to $20 resistance. If it breaks above $20, it could revisit $30 for a +50% gain.

Price is approaching resistance, which is a level where it could pause or reverse its recent advance, at least temporarily. Once the price breaks above resistance, it can advance higher to the next resistance level.
Based on the current metrics, the short-, medium-, and long-term trends are strongly down. However, things may change if the resistance breaks.
The nearest resistance level will be $30 following a breakout from $20, while the nearest support level is $14.
Subscribe to our YouTube channel for daily crypto updates, market insights, and expert analysis.
We recommend eToro
Wide range of assets: cryptocurrencies alongside other investment products such as stocks and ETFs.
Copy trading: allows users to copy the trades of leading traders, for free.
User-friendly: eToro’s web-based platform and mobile app are user-friendly and easy to navigate.


