The SEI price has quietly been setting up one of the more interesting chart structures in the market right now. After weeks of steady bleeding and no real volatility, the token is finally showing early signs of a potential reversal.
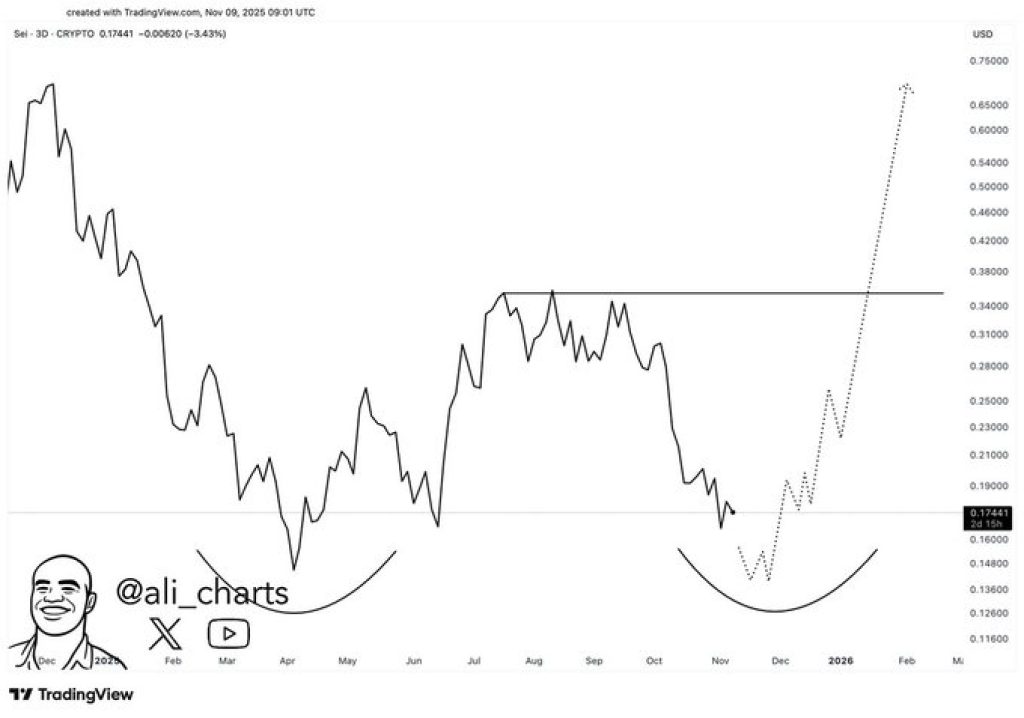
And according to market analyst Ali, this setup could become something much bigger. He believes SEI may be forming a clean double-bottom pattern, one that points toward a breakout that could push the price all the way to the $0.70 region. That would mean a move of more than 400% from current levels.
This call is gaining attention because the double-bottom pattern is one of the most reliable reversal structures in technical analysis, especially when it forms after months of heavy downside.
The SEI price has been trapped in a long-term downtrend since early summer, so the idea of a strong recovery rally is something traders have started to take seriously again.
What the SEI Chart Is Showing
The chart Ali shared makes the potential structure very clear. SEI has printed two major cyclical lows – one in early March and another forming right now – both showing a similar rounded shape.
The neckline of this entire structure sits around the $0.34 to $0.36 zone, a level that rejected the SEI price multiple times over the past few months. For this pattern to confirm, SEI needs to reclaim that line and close above it with strong momentum.
Price is pushing off the second bottom with a noticeable shift in trend. The series of lower highs that dominated throughout September and October looks like it is flattening out.
Moreso, buyers are finally showing some willingness to step back in, and the structure is tightening enough that a breakout attempt could realistically happen anytime between late November and mid-December.
If the SEI price can flip the neckline into support, the measured move of the double bottom lines up almost perfectly with Ali’s $0.70 target.
Read Also: Official Trump (TRUMP) Crashes 90% Since Launch, and the Worst May Still Be Ahead
Moreover, the strongest support sits at the $0.15 to $0.17 area – the zone that has now acted as a base twice this year. As long as SEI holds above this region, the reversal structure remains valid.
The biggest resistance is clearly the neckline around $0.34, followed by another barrier near $0.42. Those are the levels to watch because once they break, momentum can shift quickly. The chart already shows a visible uptick in volatility after weeks of tight price action, which is usually what happens before a key breakout.
SEI Price Outlook – What Happens Next?
If buyers keep defending the $0.17 zone and SEI continues to build upward structure, the market could move into a breakout phase sooner than expected.
A clean reclaim of the $0.34 neckline opens the door to $0.42, and beyond that, the measured move points to the $0.70 area. That’s where the full 400 percent projection lands, and it lines up with historical resistance from early 2024.
If the SEI price fails to hold its second bottom, then the entire setup becomes weaker, and the token could slip back toward the $0.15 support.
But right now, the chart is leaning more bullish than bearish, and the structure Ali highlighted is one that many traders watch closely because of how explosive it can become once confirmed.
For now, the market is simply waiting for the SEI price to make its next big move. If the double bottom plays out the way the analyst expects, the coming weeks could be far more volatile than the last few months – and for SEI holders, potentially a lot more exciting.
Subscribe to our YouTube channel for daily crypto updates, market insights, and expert analysis.