
SEI price has been under pressure lately, sliding from the $0.34–$0.35 range to a low near $0.31. The 1-hour chart shows a sharp drop followed by some sideways trading as buyers tried to find a floor. At the time of writing, SEI is holding around $0.318–$0.320 and trying to recover some of those losses.
Analyst Ali shared a fresh update on X, noting that the pullback might be nearing its end. He sees a possible rebound back toward $0.34 in the short term, which would erase most of the recent dip if momentum kicks in.
What the SEI Chart Is Showing
On the 1H SEI chart, you can see the heavy sell-off that took the price down from the $0.34 zone. The key detail Ali highlights is a TD Sequential buy signal forming right at the recent low. This indicator is often used to catch trend reversals after an extended decline.
Supporting that signal is a bullish divergence between price and the Relative Strength Index (RSI). While the price printed lower lows, the RSI started making higher lows, which is usually an early clue that selling pressure is fading and buyers are quietly stepping back in.
The chart also marks possible upside targets. If SEI price can hold the $0.31 support and push higher, the next checkpoints sit near $0.324 and $0.338 before a full test of $0.34.
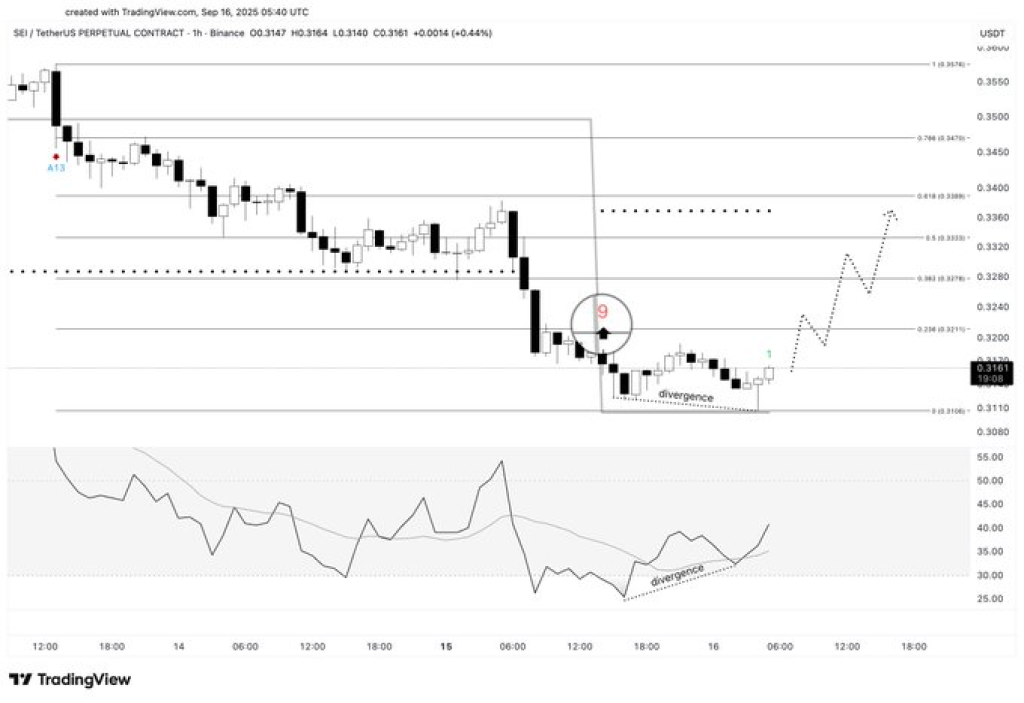
Moreover, momentum indicators back up Ali’s view. The RSI is climbing out of oversold territory, a sign that buyers are gaining strength. The TD Sequential buy setup, essentially a count of nine consecutive down candles, signals that the downtrend may be exhausted.
Trading volume remains modest, but a pickup here would help confirm a breakout. Traders will be watching for stronger inflows to support any move toward $0.34.
Read Also: 4 Reasons Mantle (MNT) Price Is Headed to $3
SEI Price Short-Term Outlook
If the bullish divergence holds and the TD Sequential buy signal plays out, SEI price could reclaim $0.34 in the coming sessions. A clean move above that level might even open the door for a run toward $0.35 and beyond.
However, a drop back below $0.31 would weaken the setup and could invite another round of selling. For now, the chart suggests buyers have a short-term edge, and Ali believes this could be the start of a fresh rebound.
Subscribe to our YouTube channel for daily crypto updates, market insights, and expert analysis.