Chainlink may be gearing up for one of its biggest moves yet. A crypto market expert shared a weekly chart that lays out what he calls the most bullish setup for LINK. Ali on X posted that chart and walked through a simple roadmap from a potential dip to $16 up to a run toward $100.
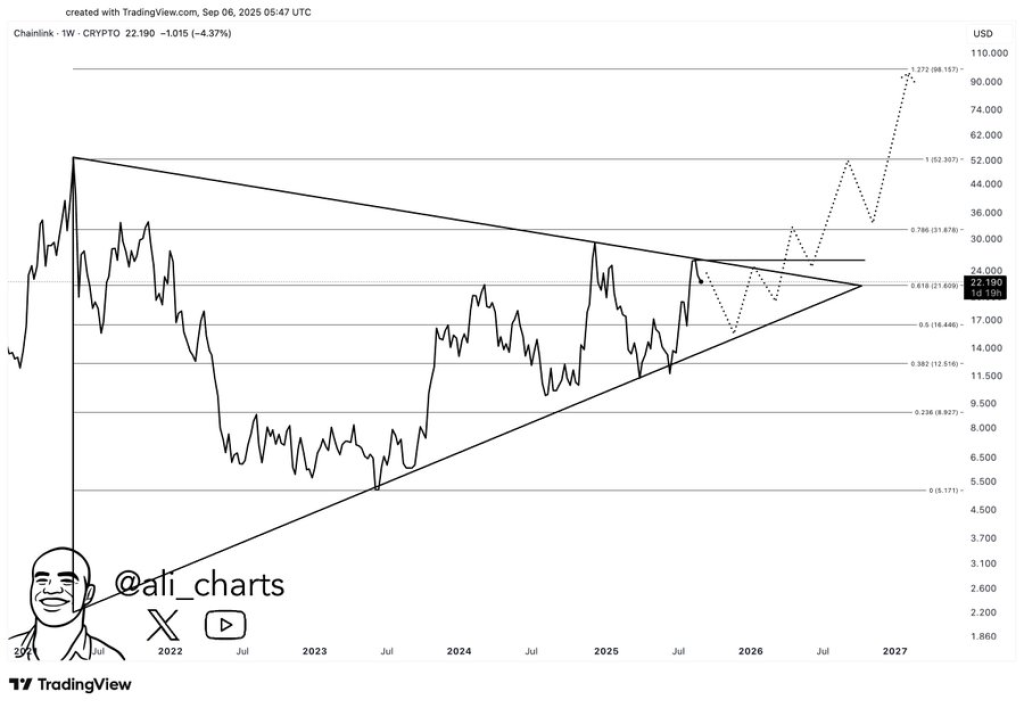
The picture is easy to follow. A large triangle has been forming since 2022 and a set of Fibonacci lines sit on top of that structure. A clean retest near $16 would line these pieces up in a way that could make a breakout more likely.
Why LINK Price Is Drawing Attention as a Triangle Nears Its Apex
The chart from Ali on X shows price squeezing inside a wide symmetrical triangle that stretches back to 2022. Current price sits near $22 which lands close to the 0.618 Fibonacci level at $21.61. A retest down to $16 would match the 0.5 Fibonacci level at $16.49 and create a higher low inside the triangle.
That sort of setup often gives a clearer launch pad for a meaningful upward move once resistance is cleared. The descending trendline sits near $24 so a decisive push above that level would be the first technical green light on this map.
Chainlink is a decentralized oracle network that feeds off chain data into smart contracts. Oracles provide price feeds and external signals that many protocols depend on. Stronger demand for those services can increase utility for LINK tokens because nodes use LINK for payments and staking.
This real world utility links protocol adoption to potential token demand. That connection is one reason why technical setups for Chainlink price draw attention beyond pure chart watching.
What Ali on X’s Chart Shows With Fibonacci Lines and the Path to $100
Ali on X drew Fibonacci retracements from a major top down to a deep low. Key levels on the chart read roughly as 0 at $1.17, 0.236 at $8.30, 0.382 at $12.20, 0.5 at $16.49, 0.618 at $21.61, and 0.786 at $31.88. Fibonacci extensions appear at 1.0 near $52.31 and 1.272 near $98.16 which sits very close to $100.
The dotted projection on the image sketches a plausible route. That route shows a dip into the triangle toward $16, a bounce that clears the descending resistance around $24, then a push to 0.786 near $31.88, followed by a march to $52 and onward to the 1.272 extension around $98.
The weekly time frame that Ali used means this is a multi month and multi year scenario. Moves of this size tend to play out slowly. A clean higher low at $16 would improve odds for the sort of breakout that leads to the targets on the Fibonacci roadmap.
The projection looks staged rather than instant. It asks for multiple confirmations along the way before $100 comes into view.
A useful analogy is an old rocket on a long countdown. First stage checks must pass, then second stage ignites, then the real burn starts.
The triangle would act like the countdown. The Fibonacci levels act like the stages that need clearing before reaching orbit. That image reminds some observers of other altcoin cycles where long consolidation preceded big moves.
Ali on X put a clear technical case on the table. A dip to $16 could be the most bullish setup for Chainlink, because it would create a neat higher low inside a decade spanning triangle and align price with key Fibonacci support.
Read Also: 5 Bold Moves That Could Push Shiba Inu (SHIB) Price to $0.001 Sooner Than You Think
A breakout through resistance near $24 would open targets at $31.88, $52.31, and then the 1.272 extension around $98 which sits within striking distance of $100.
Subscribe to our YouTube channel for daily crypto updates, market insights, and expert analysis.